Multiple Choice
Identify the
choice that best completes the statement or answers the question.
|
|
|
1.
|
Write the following fractions in ascending order:  ,
 ,  ,  ,  a. |  , ,  , ,  , ,  , ,  | c. |  , ,  , ,  , ,  , ,  | b. |  , ,  , ,  , ,
 , ,  | d. |  , ,  , ,  , ,
 , ,  |
|
|
|
2.
|
A submarine descends at an average rate of 6.5 m/min. Express the depth below
the surface after 4.4 min as a rational number.
a. | -10.9 m | c. | -28.6
m | b. | 10.9 m | d. | +28.6 m |
|
|
|
3.
|
Which point on the number line approximates  ? 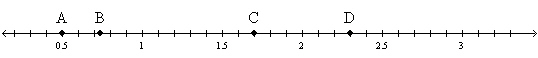
|
|
|
4.
|
A checkerboard has an area of 256 cm2. Each side of the board is made
of 8 small squares. What is the side length of each small square on the board?
a. | 4 cm | c. | 32 cm | b. | 2 cm | d. | 64 cm |
|
|
|
5.
|
What is the lowest common denominator for  ,  , and  ?
|
|
|
6.
|
Calculate  .
|
|
|
7.
|
What is  ?
|
|
|
8.
|
A square frame is projected onto a screen using an overhead projector. The
original square frame has a side length of 8.5 cm. The square frame is enlarged by a scale factor of
6.4. Determine the side length of the square frame on the screen.
a. | 14.9 cm | c. | 54.4 cm | b. | 217.6 cm | d. | 108.8 cm |
|
|
|
9.
|
Determine the scale factor for this reduction. 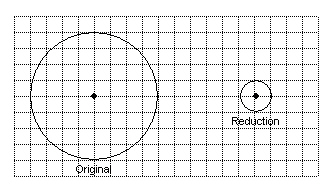
|
|
|
10.
|
Lori states that her bedroom is 4.3 units long. What unit is most appropriate
for this measurement?
a. | centimetre | c. | millimetres | b. | metres | d. | kilometres |
|
|
|
11.
|
You and your family decide to travel to the United States. After crossing the
border, you notice speed limit signs saying the maximum speed is 60 miles/hour. What is this speed in
km/hour?
a. | 60.0 km/h | c. | 102.0 km/h | b. | 37.3 km/h | d. | 96.6 km/h |
|
|
|
12.
|
Jennifer drove 560 km and used 25 L of gas. How many miles per imperial gallon
does her car get?
a. | 52.7 mi/gal | c. | 63.3 mi/gal | b. | 58.8 mi/gal | d. | 70.6 mi/gal |
|
|
|
13.
|
 is a scalene triangle with  ABC equal to 57°. A
similar triangle,  , is made using a scale factor of 7. What is the measure of
 DEF?
|
|
|
14.
|
How would you describe the two triangles below? 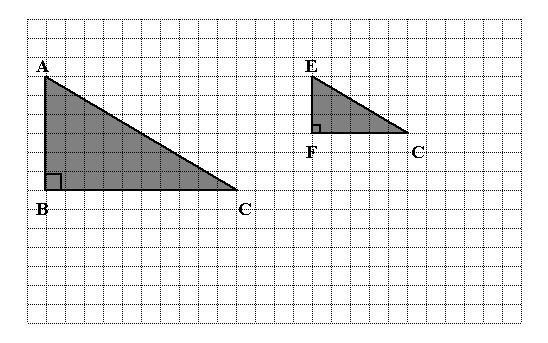 a. | obtuse triangles | c. | similar triangles | b. | complimentary triangles | d. | equilateral
triangles |
|
|
|
15.
|
Write  as the product of two powers.
|
|
|
16.
|
Write  as a quotient of two powers.
|
|
|
17.
|
Write  as a quotient of two powers.
|
|
|
18.
|
Evaluate  .
|
|
|
19.
|
If a colony of 1250 bacteria triples in size every 3 h, what is the size of the
colony after 6 h?
a. | 11 250 | c. | 1425 | b. | 1366 | d. | 1326 |
|
|
|
20.
|
If  , then what is the value of  ?
|
|
|
21.
|
Evaluate  . a. | 6561 | c. | 810 | b. | 1296 | d. | 59 049 |
|
|
|
22.
|
Identify the like terms in the following list of terms.  ,  ,
 ,  , 
|
|
|
23.
|
Simplify  .
|
|
|
24.
|
Simplify (5x2 – 2x + 9) + (8x2
+ 7x – 6).
a. | 13x2 – 5x – 15 | c. | 13x2 –
5x + 15 | b. | 13x2 – 5x – 3 | d. | 13x2 + 5x +
3 |
|
|
|
25.
|
Multiply –3x(2x2 – 4x –
5).
a. | –6x3 + 12x2 + 15x | c. | –6x3 – 12x2 –
15x | b. | –6x2 + 12x + 15 | d. | –6x3 +
12x2 – 15x |
|
|
|
26.
|
Expand –5k(8 – 5k).
a. | –40k – 5k2 | c. | –40k +
5k2 | b. | –40k –
25k2 | d. | –40k + 25k2 |
|
|
|
27.
|
What multiplication statement is modelled by the algebra tiles below? 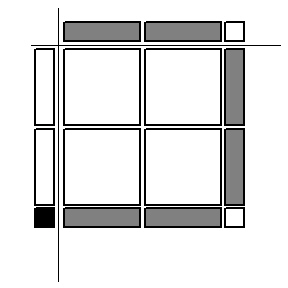
|
|
|
28.
|
Expand the expression  using the distributive property.
|
|
|
29.
|
What linear equation is represented by the following graph? 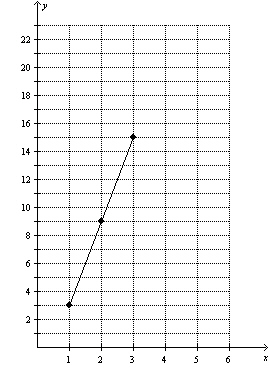
|
|
|
30.
|
The cost to print stickers is $6.95 plus $0.75 per sticker. Determine an
equation that relates the total cost, C, in dollars, to the number of stickers,
s.
|
|
|
Use the figures to answer the following question(s).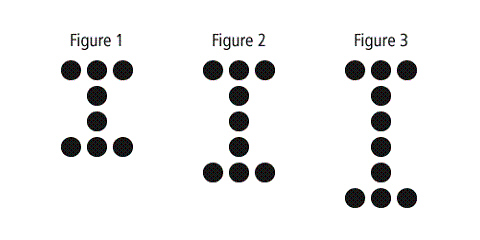
|
|
|
31.
|
Following the pattern, which figure number will have 42 dots?
|
|
|
32.
|
How many dots are in the thirteenth figure?
|
|
|
33.
|
How many dots would the next figure contain?
|
|
|
Assume that this graph shows air pressure at different altitudes. Use the
graph to answer the following question(s).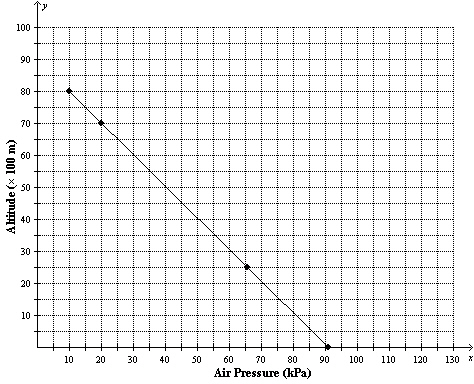
|
|
|
34.
|
If a balloonist measures the air pressure to be 75 kPa, at what approximate
altitude was the measurement taken?
a. | 1500 m | c. | 16500 m | b. | 9000 m | d. | 7500 m |
|
|
|
Use the graphs to answer the following question(s).
|
|
|
35.
|
At what time has John walked 3 m further than Bill?
|
|
|
36.
|
Solve  .
|
|
|
37.
|
Solve 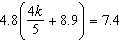 . a. | k = 13.05 | c. | k = 8.35 | b. | k = –9.2 | d. | k =
14.38 |
|
|
|
38.
|
Solve  . a. | p = 2.83 | c. | p = –0.27 | b. | p =
3.13 | d. | p =
–3.61 |
|
|
|
39.
|
Solve  . a. | t = –12.42 | c. | t =
–0.59 | b. | t = 0.74 | d. | t = –0.62 |
|
|
|
40.
|
Solve  . a. | t = 0.02 | c. | t = –0.33 | b. | t =
0.85 | d. | t =
300.8 |
|
|
|
41.
|
Solve the following: 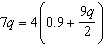 . a. | q = –0.327 | c. | q =
0.144 | b. | q = –0.314 | d. | q = 0.138 |
|
|
|
42.
|
Solve  . a. | x = 26 | c. | x = 2.8 | b. | x = –26 | d. | x =
–2.8 |
|
|
|
43.
|
The average amount of daylight per day in Calgary is 14.6 h. The average amount
of daylight per day in Vancouver is 3.9 h more than half the number of hours in Calgary. What is the
average amount of daylight per day in Vancouver?
a. | 11.2 h | c. | 3.9 h | b. | 8.6 h | d. | 10.7 h |
|
|
|
44.
|
A stratified sample is created by
a. | choosing respondents from the population who are easy to access | c. | dividing the
population into groups and then choosing the same percent of respondents from each
group | b. | inviting the whole population to participate | d. | choosing respondents from the population at
random |
|
|
|
45.
|
A sample of high school students is created by first dividing the whole student
body into age groups and then choosing the same fraction of members from each group. What type of
sampling method is used here?
a. | stratified | c. | convenience | b. | random | d. | systematic |
|
|
|
46.
|
Linda and Matt each survey 20 people about the carving in front of the post
office. Linda was at the mall entrance and Matt was at the entrance to the fine arts centre. When
they compared their results, the responses were very different. What influencing factor(s) may have
caused the difference?
a. | timing | c. | all of the these | b. | cultural sensitivity | d. | wording |
|
|
|
|
|
|
47.
|
This line graph shows the number of baskets scored by Julie and Erica during six
games. A clearer way to show this comparison might be to use a
a. | double bar graph that records the number of baskets each player scored in each
game | c. | bar graph to show the total number of baskets scored in each game | b. | pictograph showing
the total number of baskets scored in each game | d. | circle graph showing the percent of baskets
each player scored during the season |
|
|
|
|
|
|
48.
|
Which of the two graphs would you use if you wanted to know the total number of
plants in the garden?
a. | The circle graph, because it is easy to add the percents. | c. | The circle graph,
because it tells you there are 100 plants. | b. | The pictograph, because you can see how many
carrot plants are in each picture. | d. | The pictograph, because the symbols are easy to
count. |
|
|
|
|
|
|
49.
|
Another good way to compare the fraction of cell phone calls made by each user
would be to use a
a. | pictograph with big cell phones for people who call a lot and little cell phones for
people who don’t | c. | double bar graph, to compare two sets of data | b. | circle graph, to
show the percent of calls made by each user | d. | line graph, to show the change in cell phone use over
time |
|
|
|
|
|
|
50.
|
Which graph would be best for showing what percent of the time each type of
movie was chosen?
a. | double bar graph | c. | circle graph | b. | bar graph | d. | line graph |
|