Multiple Choice
Identify the
choice that best completes the statement or answers the question.
|
|
|
1.
|
Which point on the number line represents the rational number  ? 
|
|
|
2.
|
The rational number represented by point X on the number line is
__________. 
|
|
|
3.
|
One day, the temperature fell from 1.5 °C to –2.7 °C in 2 hours.
What was the temperature change per hour?
a. | 2.1 °C/h | c. | –4.2 °C/h | b. | –2.1 °C/h | d. | 4.2 °C/h |
|
|
|
4.
|
The recycling bin was  full at the beginning of the week. The
bin was filled another  by the end of the week. How full was the bin at the end of
the week?
|
|
|
5.
|
Which decimal has a square root between 12 and 13?
a. | 182.3 | c. | 152.5 | b. | 12.5 | d. | 121 |
|
|
|
6.
|
Isla is building a fence around her deck. The deck has an area of 65
m2. It costs $125 to build each metre of fencing. How much will Isla spend, to the nearest
whole dollar?
a. | $2031 | c. | $1008 | b. | $4063 | d. | $4031 |
|
|
|
7.
|
What is the result of  , in lowest terms?
|
|
|
8.
|
Determine the scale factor for this reduction. 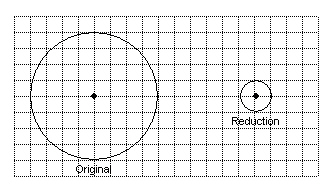
|
|
|
9.
|
A square has a side length of 3.2 cm. The side length of the enlargement is 9.6
cm. Determine the scale factor.
|
|
|
10.
|
Advertising posters often show smaller images of large objects (like a car) or
larger images of small objects (like a calculator). If an actual object has a length of 256 cm and
the image on the poster is 160 cm, what is the scale used to make the poster?
|
|
|
11.
|
Canada’s official measurement system is the __________.
a. | Avoirdupois system | c. | SI system | b. | US system | d. | imperial system |
|
|
|
12.
|
Lori states that her bedroom is 4.3 units long. What unit is most appropriate
for this measurement?
a. | centimetre | c. | millimetres | b. | metres | d. | kilometres |
|
|
|
13.
|
Triangles A and B are similar isosceles right triangles, related by a scale of
3:1. If the hypotenuse of Triangle B is 89.0 cm, what is the length of the hypotenuse of Triangle
A? 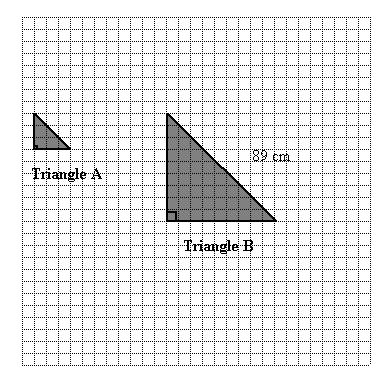 a. | 29.7 cm | c. | 14.8 cm | b. | 125.9 cm | d. | 89.0 cm |
|
|
|
14.
|
A calculator is 12 cm long. The length of the calculator on a poster
advertisement is 27 cm. What is the scale used to create the poster?
|
|
|
15.
|
The population of wolves in a certain area is 3250. If the growth of the wolf
population is 1.9% per year, what will be the population in 15 years?
|
|
|
16.
|
Two cubes have edge lengths of 9 cm and 3 cm, respectively. What is the
difference in volume of the two cubes?
a. | 702 cm3 | c. | 756 cm3 | b. | 243 cm3 | d. | 27
cm3 |
|
|
|
17.
|
A cube has an edge length of 4 cm. A second cube has an edge length of 256 cm.
How many times greater is the volume of the second cube?
a. | 16 777 152 | c. | 262 144 | b. | 64 | d. | 192 |
|
|
|
18.
|
Evaluate  .
|
|
|
19.
|
Evaluate: 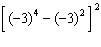 . a. | 8100 | c. | –8100 | b. | –5184 | d. | 5184 |
|
|
|
20.
|
Determine the value of x if  .
|
|
|
21.
|
Determine the value of x if  .
|
|
|
22.
|
How many terms are there in the expression  ?
|
|
|
23.
|
|
|
|
24.
|
Simplify (5x2 – 2x + 9) + (8x2
+ 7x – 6).
a. | 13x2 – 5x – 15 | c. | 13x2 –
5x + 15 | b. | 13x2 – 5x – 3 | d. | 13x2 + 5x +
3 |
|
|
|
25.
|
Determine the multiplication statement modelled by the algebra
tiles. 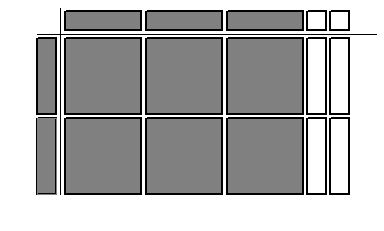
|
|
|
26.
|
What division statement is modelled by the algebra tiles? 
|
|
|
27.
|
Add the following polynomials. 
|
|
|
28.
|
Expand the expression  using the distributive property.
|
|
|
Assume that this graph shows air pressure at different altitudes. Use the
graph to answer the following question(s).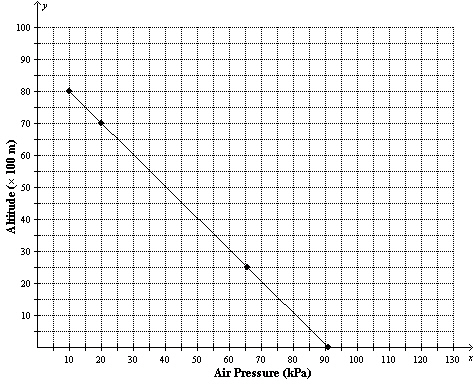
|
|
|
29.
|
When a mountain climber reaches an altitude of 1000 m, what is the approximate
air pressure?
a. | 78 kPa | c. | 75 kPa | b. | 80 kPa | d. | 82 kPa |
|
|
|
Use the graphs to answer the following question(s).
|
|
|
30.
|
Who walked farther in the first 2 s and by how much?
a. | Bill; 1 m | c. | John; 1 m | b. | Bill; 2 m | d. | John; 2 m |
|
|
|
31.
|
A theatre has 22 seats in the first row, 34 seats in the second row, 46 seats in
the third row, and so on. What is the linear equation that represents the number of seats, s,
in each row, r?
|
|
|
Use the figures to answer the following question(s).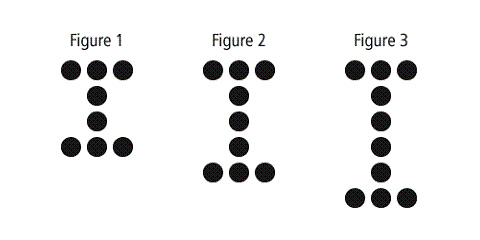
|
|
|
32.
|
Following the pattern above, how many dots will Figure 5 contain?
|
|
|
33.
|
Following the pattern, which figure number will have 42 dots?
|
|
|
34.
|
As flowerpots are added individually to a stack, the height of the new stack is
represented by the following graph. What is the height of a stack of 6 flowerpots? 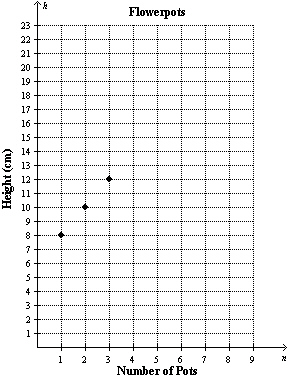 a. | 22 cm | c. | 24 cm | b. | 18 cm | d. | 16 cm |
|
|
|
35.
|
In the equation  , determine the value of P when n = 13.
|
|
|
36.
|
Solve  .
|
|
|
37.
|
Solve  .
|
|
|
38.
|
Solve the following:  .
|
|
|
39.
|
Solve  . a. | p = –1.17 | c. | p = –1.72 | b. | p =
–0.05 | d. | p =
3.45 |
|
|
|
40.
|
What is the value of x if  ? a. | x = –4 | c. | x = –0.25 | b. | x =
1 | d. | x =
0.25 |
|
|
|
41.
|
Solve for w in  . a. | w = 6 | c. | w = 0.75 | b. | w = 3.75 | d. | w = 30 |
|
|
|
42.
|
Solve the following: 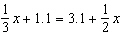 . a. | x = –25.2 | c. | x = 2.4 | b. | x = 5.0 | d. | x =
–12 |
|
|
|
43.
|
The average amount of daylight per day in Calgary is 14.6 h. The average amount
of daylight per day in Vancouver is 3.9 h more than half the number of hours in Calgary. What is the
average amount of daylight per day in Vancouver?
a. | 11.2 h | c. | 3.9 h | b. | 8.6 h | d. | 10.7 h |
|
|
|
44.
|
In which situation might timing be an influencing factor?
a. | A teacher asks her class to complete a survey with the question, “What is your
favourite subject?” | c. | After a baseball game, the people leaving the stadium are surveyed
to determine their favourite sport. | b. | Every household in the city is mailed a survey
asking, “Do you think it is important to maintain the city’s
parks?” | d. | Students in a
grade 5 class are asked, “Do you like your parents?” |
|
|
|
Answer the following question(s) using the information from the scenario
below.
The owner of a pet store in a shopping mall wants to conduct a survey. She decides
to survey the first 100 people who pass her store as soon as the mall opens. She chooses this time
because her store is not busy first thing in the morning.
|
|
|
45.
|
If she walked around the mall and surveyed every tenth person, this would
provide a
a. | systematic sample | c. | convenience sample | b. | voluntary response sample | d. | random sample |
|
|
|
46.
|
Predictions based on a sample taken from a normally distributed population are
more accurate when
a. | the sample population is all the same age | c. | the sample size is
large | b. | the sample size is small | d. | the sample is taken from only one geographical part of the
area |
|
|
|
47.
|
How could you alter this graph to make it misleading?  a. | Change the names of the participants. | c. | Put Larry’s data first,
followed by Sandi’s, then Farah’s, and then Lori’s. | b. | Use better pictures
of balls that are all the same size. | d. | Make Sandi’s balls bigger than Lori’s balls so that Sandi’s line is
longer. |
|
|
|
|
|
|
48.
|
What makes this graph misleading?
a. | The representation of Indira’s calls is shorter than the others. | c. | The representation
of Samantha’s calls is taller than the others. | b. | The representation of users’ calls is not
a consistent width. | d. | The
representation of each user’s calls is a different height. |
|
|
|
|
|
|
49.
|
Which graph would be best for showing what percent of the time each type of
movie was chosen?
a. | double bar graph | c. | circle graph | b. | bar graph | d. | line graph |
|
|
|
50.
|
Which graph would be best for showing the number of each type of movie that was
chosen?
a. | circle graph | c. | bar graph | b. | line graph | d. | double bar
graph |
|