Multiple Choice
Identify the
choice that best completes the statement or answers the question.
|
|
|
1.
|
Write the following fractions in ascending order:  ,
 ,  ,  ,  a. |  , ,  , ,  , ,  , ,  | c. |  , ,  , ,  , ,  , ,  | b. |  , ,  , ,  , ,
 , ,  | d. |  , ,  , ,  , ,
 , ,  |
|
|
|
2.
|
Which decimal has a square root between 12 and 13?
a. | 182.3 | c. | 152.5 | b. | 12.5 | d. | 121 |
|
|
|
3.
|
Estimate the value of  , to the nearest tenth.
|
|
|
4.
|
The lengths of the two legs of a right triangle are 6.3 cm and 3.2 cm. Determine
the length of the hypotenuse, to the nearest tenth of a centimetre.
a. | 49.9 cm | c. | 5.4 cm | b. | 3.1 cm | d. | 7.1 cm |
|
|
|
5.
|
Ethan is building a fence around his square garden. The garden has an area of
54.99 m2. It costs $98.25 to build each metre of fencing. How much will Ethan spend, to
the nearest whole dollar?
a. | $2873 | c. | $729 | b. | $2916 | d. | $5403 |
|
|
|
6.
|
Calculate  .
|
|
|
7.
|
What is  ?
|
|
|
8.
|
Matt wants to build a trundle wheel, or measuring wheel. He wants the wheel to
go around once for every 1.7 metres the trundle wheel is pushed. What will be the approximate
diameter of his trundle wheel?
a. | 3.70 m | c. | 1.08 m | b. | 0.27 m | d. | 0.54 m |
|
|
|
9.
|
Triangles A and B are similar isosceles right triangles, related by a scale of
2:1. The two legs of Triangle A are 71.0 mm long. What is the approximate length of the hypotenuse of
Triangle B? 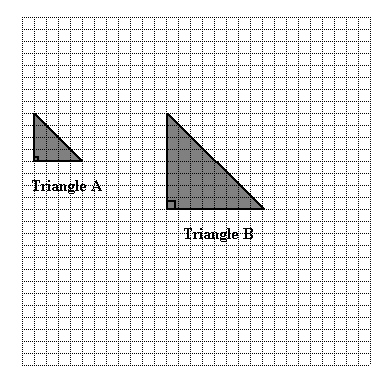 a. | 200.8 mm | c. | 142.0 mm | b. | 100.4 mm | d. | 71.0 mm |
|
|
|
10.
|
A farmer sketched the following layout of a field. He wants to develop a scale
drawing of the field in which 1 cm on the diagram represents 5 m of actual distance. The pipeline
runs across the diagonal of the field. Approximately how long will the line that represents the
pipeline be in the scale diagram? 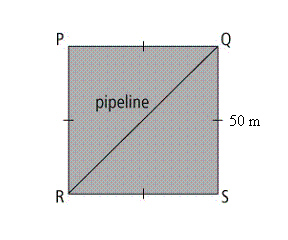 a. | 500.0 cm | c. | 14.1 cm | b. | 10.0 cm | d. | 5.0 cm |
|
|
|
11.
|
Ray wants to draw a scale diagram of the field shown in the sketch. He plans to
use a scale of 1 mm : 4 m. How long should he draw line AB if he wants to represent a distance of 180
m? 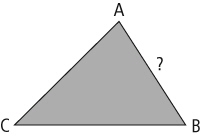 a. | 45 mm | c. | 400 mm | b. | 720 mm | d. | 4 mm |
|
|
|
12.
|
What scale must be applied to make equilateral triangle JKL from equilateral
triangle RST? 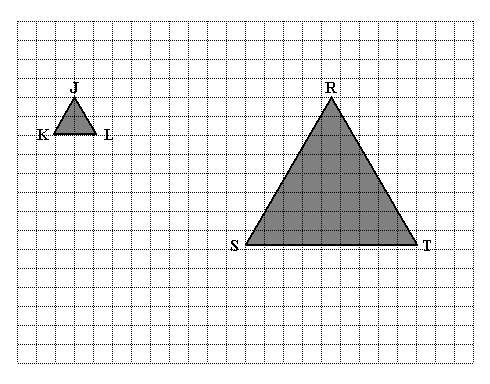
|
|
|
13.
|
What scale is used to create the image on the right from the original image on
the left? 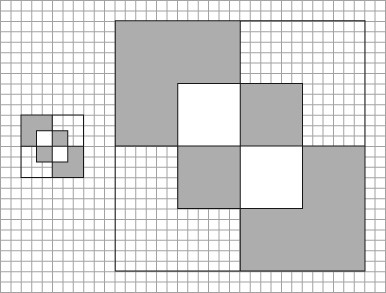
|
|
|
14.
|
The image of a cellphone on a poster is 18.6 cm long. The actual cellphone is
9.3 cm long. Determine the scale used to create the poster.
|
|
|
15.
|
Evaluate the power  .
|
|
|
16.
|
Write  as the product of two powers.
|
|
|
17.
|
Write  as a single power.
|
|
|
18.
|
Which of the following numbers has the greatest value:  ,  ,
 ,  ,  ?
|
|
|
19.
|
A cube has an edge length of 4 cm. A second cube has an edge length of 256 cm.
How many times greater is the volume of the second cube?
a. | 16 777 152 | c. | 262 144 | b. | 64 | d. | 192 |
|
|
|
20.
|
Evaluate  .
|
|
|
21.
|
Evaluate:  . a. | 8100 | c. | –8100 | b. | –5184 | d. | 5184 |
|
|
|
22.
|
The polynomial  can be best described as a __________. a. | term | c. | binomial | b. | trinomial | d. | monomial |
|
|
|
23.
|
Subtract the following polynomials. 
|
|
|
24.
|
What multiplication statement is represented by the algebra tiles below? 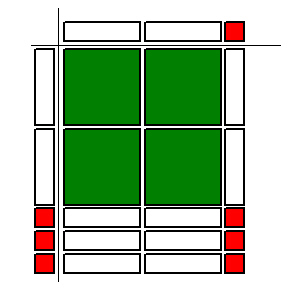
|
|
|
25.
|
Expand the expression  using the distributive property.
|
|
|
26.
|
Use the distributive property to expand  .
|
|
|
27.
|
A rectangular tank has the dimensions shown below. Determine the height of the
tank when the volume, V, is given by the equation:  . 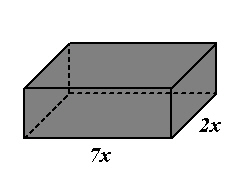
|
|
|
28.
|
What division statement is represented by the algebra tiles? 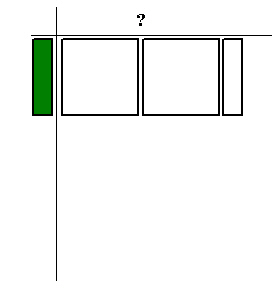
|
|
|
Choose the best answer.
|
|
|
29.
|
What is the equation of the linear relation represented by the following
graph? 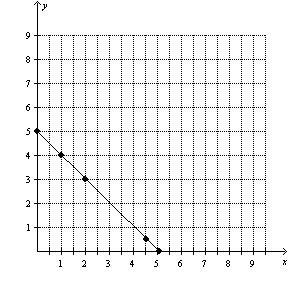
|
|
|
30.
|
Sampling bias may result when
a. | the sample accurately represents the population | c. | participants are chosen at
random | b. | culturally sensitive questions are asked in the survey | d. | a large percent of people in the sample refuse
to answer the survey |
|
|
|
Assume that this graph shows air pressure at different altitudes. Use the
graph to answer the following question(s).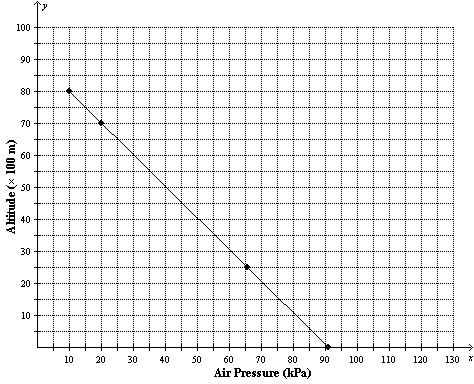
|
|
|
31.
|
If a balloonist measures the air pressure to be 70 kPa, at what approximate
altitude was the measurement taken?
a. | 2000 m | c. | 7000 m | b. | 16000 m | d. | 9000 m |
|
|
|
32.
|
What linear equation is represented by the following graph? 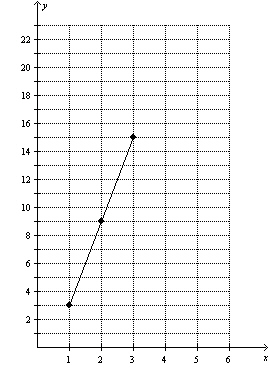
|
|
|
33.
|
As flowerpots are added individually to a stack, the height of the new stack is
represented by the following graph. What is the height of a stack of 6 flowerpots? 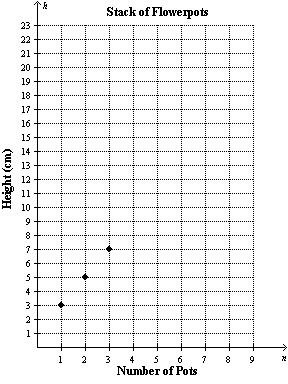 a. | 17 cm | c. | 13 cm | b. | 11 cm | d. | 19 cm |
|
|
|
34.
|
A car travels at a constant speed. The graph shows how the distance of the car
changes with time. Estimate the time it takes to travel 360 km. 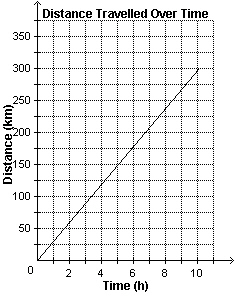
|
|
|
Use the figures to answer the following question(s).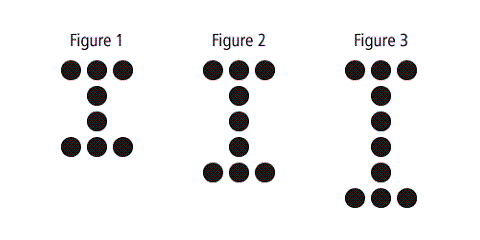
|
|
|
35.
|
Following the pattern above, how many dots will Figure 5 contain?
|
|
|
36.
|
How many dots are in the thirteenth figure?
|
|
|
37.
|
Solve  .
|
|
|
38.
|
Solve the following:  .
|
|
|
39.
|
Solve the following:  .
|
|
|
40.
|
A rectangle has a width of  cm and a length of  cm. What is
the perimeter of the rectangle? a. |  cm cm | c. | 6 cm | b. | 16
cm | d. | r + 16
cm |
|
|
|
41.
|
What is the solution to the equation  ? a. | t = 0.93 | c. | t = –0.07 | b. | t =
3.25 | d. | t =
–0.25 |
|
|
|
42.
|
Solve the following: 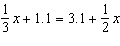 . a. | x = –25.2 | c. | x = 2.4 | b. | x = 5.0 | d. | x =
–12 |
|
|
|
43.
|
Solve 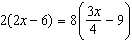 . a. | x = 6 | c. | x = 8.4 | b. | x = 30 | d. | x =
–42 |
|
|
|
44.
|
Julie puts 67 blue buttons in a bag. This number is 13 more than half the number
of red buttons. The number of yellow buttons is one quarter the number of red buttons. How many
yellow buttons are there in the tin?
|
|
|
45.
|
A voluntary response sample is created by
a. | dividing the population into groups and then choosing the same percent of respondents
from each group | c. | inviting the whole population to participate if they wish | b. | choosing respondents
from the population who are easy to access | d. | choosing respondents from the population at random |
|
|
|
46.
|
A systematic sample is created by
a. | choosing respondents from the population who are easy to access | c. | inviting the whole
population to participate if they wish | b. | choosing survey respondents at fixed intervals
from an ordered list of the entire population | d. | choosing respondents from the population at
random |
|
|
|
47.
|
Which of the following methods will give a simple random sample?
a. | Survey the students in your class who walked to school that day. | c. | Survey the students
who the teacher selects to answer questions. | b. | Survey the first 15 students who enter the
classroom. | d. | Survey the
students whose names you pick from a hat. |
|
|
|
|
|
|
48.
|
This line graph shows the number of baskets scored by Julie and Erica during six
games. A clearer way to show this comparison might be to use a
a. | double bar graph that records the number of baskets each player scored in each
game | c. | bar graph to show the total number of baskets scored in each game | b. | pictograph showing
the total number of baskets scored in each game | d. | circle graph showing the percent of baskets
each player scored during the season |
|
|
|
49.
|
How could you distort the graph to decrease the improvement between Game 4 and
Game 6?
a. | Change the thickness of the lines. | c. | Change the symbols on the line for
each player. | b. | Change the y-axis so that the higher numbers have smaller gaps between
them. | d. | Change the
x-axis to allow a break before Game 4. |
|
|
|
|
|
|
50.
|
Which graph would be best for showing what percent of the time each type of
movie was chosen?
a. | double bar graph | c. | circle graph | b. | bar graph | d. | line graph |
|