Multiple Choice
Identify the
choice that best completes the statement or answers the question.
|
|
|
1.
|
In a table of values for a pattern, P = 12 when n = 3. Determine
the equation that might represent the pattern.
|
|
|
2.
|
The pattern in this table continues. Determine the expression that relates the
number of triangles to the figure number. | Figure, f | 1 | 2 | 3 | 4 | 5 | | Number of Triangles,
t | 2 | 4 | 6 | 8 | 10 | | | | | | |
|
|
|
3.
|
The cost to rent a piece of equipment is $24, plus $8.27 per hour.
Calculate
the cost of renting the equipment for 6 h.
a. | $1190.88 | b. | $73.62 | c. | $193.62 | d. | $38.27 |
|
|
|
4.
|
Complete the table of values.  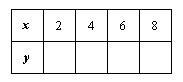
|
|
|
5.
|
Which points lie on the graph represented by the equation  ? P(1,
9), Q(2, 18), R(2, 4), S(0, 9) a. | P and Q | b. | Q and R | c. | R and S | d. | P and
R |
|
|
|
6.
|
Which line is the graph of y = 2? 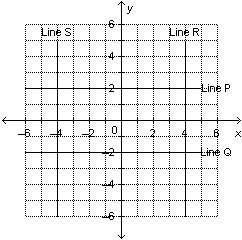 a. | Line S | b. | Line P | c. | Line Q | d. | Line
R |
|
|
|
7.
|
Which equation describes a horizontal line?
|
|
|
8.
|
Which equations describe oblique lines? a. | iii and iv | b. | ii and iv | c. | i and iii | d. | i and
iv |
|
|
|
9.
|
Which graph on this grid has the equation  ? 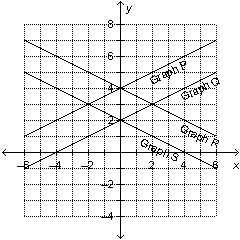 a. | Graph Q | b. | Graph P | c. | Graph S | d. | Graph
R |
|
|
|
10.
|
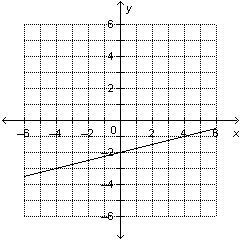
This graph represents a linear relation. Determine the value of x
when y = –2. 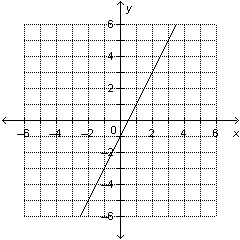
|
Short Answer
|
|
|
11.
|
Shirley has $540 in her bank account. She withdraws $35 each week to cover her
expenses. a) Write an equation that
relates the amount of money in her account, A dollars, after n
weeks.
b) Determine the amount of money in Shirley’s account
after 8 weeks.
|
|
|
12.
|
The first term value, f, in a pattern is 25. As the term number
increases by 1, the term value increases by 4. a) Create a table of values for the
pattern.
b) Write an expression for the term value in terms of the
term number, n.
|
|
|
13.
|
Which equations represent a linear relation?
|
|
|
14.
|
This is a partially completed table of values for
a linear relation.
a) Determine the missing values of
y.
b) Write an equation that represents the
linear relation.
|
|
|
15.
|
This graph represents a linear relation. a) Estimate the value of y when
x = –3.
b) Estimate the value of x when y
= –1.5.
|
Problem
|
|
|
16.
|
This pattern of squares continues. 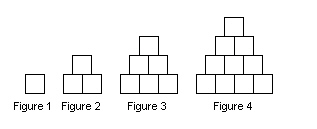 a) Which equation relates the number of
squares, s, to the figure number, n?
i) 
ii) 
iii)  b) Determine the number of
squares in figure 35.
|
|
|
17.
|
a) Create a table of values for the relation  ,
then graph the relation. Use 0, 2,
4, 6, 8, 10 as values of x.
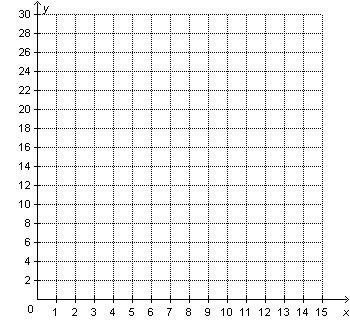 b) Is the relation
linear? How do you know? c) What is the value of y when
x = 33?
|
|
|
18.
|
Amir went to a pie-tasting festival. The festival charges an admission fee of
$3.00, plus $2.00 for every slice of pie you eat. a) Write an equation that relates the total
cost, C dollars, to the number of slices of pie you eat,
r. b) Graph the equation. Which variable will you plot on the
horizontal axis? Explain your reasoning. 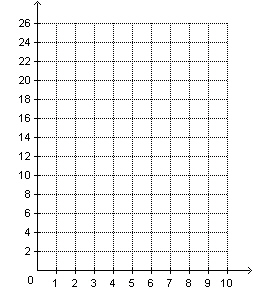 c) Will
you join the points on the graph? Explain. d) If Amir spent $17.00,
how many slices of pie did he eat?
|
|
|
19.
|
a) Graph the
following lines on the same grid. What shape do they form?
i) 
ii) 
iii) 
iv)   b)
When Joan graphed the lines she made a mistake. Instead of graphing  and  , she graphed
 and  . What did Joan’s
graph look like? 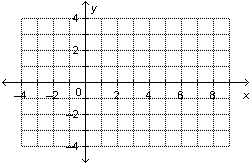
|
|
|
20.
|
Two points on the graph below have coordinates A(2,–3) and
B(–4,0). Which equation matches the graph? Show your work. 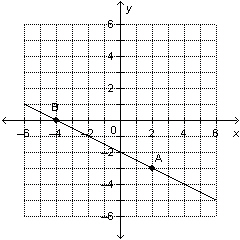
|