Multiple Choice
Identify the
choice that best completes the statement or answers the question.
|
|
|
1.
|
Which ordered pair belongs to the relation shown in the diagram below? 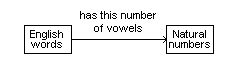 a. | (function, 4) | c. | (relation, 4) | b. | (arrow, 4) | d. | (mathematics,
2) |
|
|
|
2.
|
This graph shows the height of the tide in a harbour as a function of time in
one day. Which statement best describes the tide at Point C? 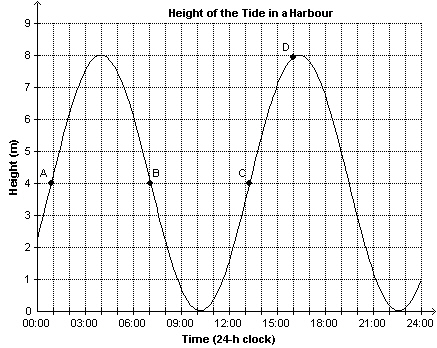 a. | The tide is at its greatest height. | c. | The tide is 7.1 m
high. | b. | The tide is at its least height. | d. | The tide is 4 m
high. |
|
|
|
3.
|
Which graph best represents the cost of renting a kayak as a function of
time?
|
|
|
4.
|
Each graph below shows distance, d metres, as a function of time,
t hours. Which graph has a rate of change of 0.75 m/h and a horizontal intercept of 3
m?
|
|
|
5.
|
This graph represents the time it takes to fill a 140-L hot-water tank.
Determine the volume of water in the tank after 50
min.
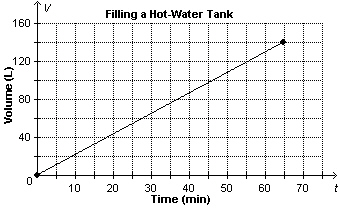 a. | about 23 L | c. | about 119 L | b. | about 97 L | d. | about 108 L |
|
|
|
6.
|
Distance travelled, d, is a linear function of time, t. After 75
min. a bus travelled 50 km. After 165 min. the bus travelled 110 km. Write an equation to represent
this function.
|
|
|
7.
|
Write an equation in slope-point form for the line that passes through
A(–2, 4) and
B(–9, 6).
|
|
|
8.
|
Write an equation in slope-point form for the line that passes through A(1, 4)
and B(6, 8).
|
|
|
9.
|
A line has x-intercept –9 and y-intercept 3. Determine the
equation of the line in general form.
|
|
|
10.
|
Jon has x egg cartons that hold 12 eggs and y egg cartons that
hold 18 eggs. He uses these cartons to store 72 eggs. Which equation represents the relation?
|
|
|
11.
|
Capital cities can be associated with the province or territory they are
in. | Capital
City | Province/Territory | | Victoria | British Columbia | | Edmonton | Alberta | | Regina | Saskatchewan | | Winnipeg | Manitoba | | Whitehorse | Yukon | | Yellowknife | Northwest
Territories | | Iqaluit | Nunavut | | |
Describe
this relation in words. a. | The relation shows the association “is the capital of” from a set of
capital cities to a set of provinces and territories. | b. | The relation shows the association “is
the largest city of” from a set of capital cities to a set of provinces and territories.
| c. | The relation shows the association “is the capital of” from a set of
provinces and territories to a set of capital cities. | d. | The relation shows the association “is in
the province/territory of” from a set of provinces and territories to a set of capital
cities. |
|
|
|
12.
|
For the function  , determine  .
|
|
|
13.
|
Write  as an equation in two variables.
|
|
|
14.
|
Write  in function notation.
|
|
|
15.
|
This graph shows the free-fall speed of a skydiver as a function of time. At
what speed was the skydiver travelling 10 s before she reached the ground? 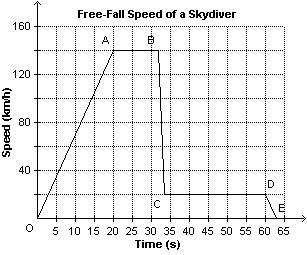 a. | 20 km/h | b. | 140 km/h | c. | 30 km/h | d. | 10
km/h |
|
|
|
16.
|
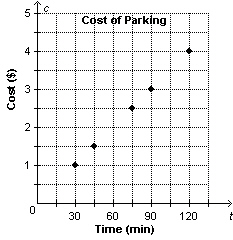
This graph shows the cost of parking, c, as a function of time, t.
Determine the domain of the
graph.
|
|
|
17.
|
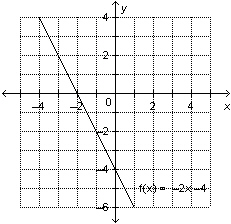
This is a graph of the function  . Determine the domain value when the
range value is
–2.
|
|
|
18.
|
The altitude of a plane, a metres, is related to the time, t
minutes, that has elapsed since it started its ascent. Determine the rate of change of this linear
relation. t (min) | 0 | 2 | 4 | 6 | 8 | a (m) | 4000 | 5400 | 6800 | 8200 | 9600 | | | | | | |
a. | 1500 m/min | b. | 1400 m/min | c. | 1200 m/min | d. | 700
m/min |
|
|
|
19.
|
Which set of ordered pairs represents a linear relation? i) 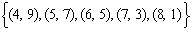 ii) 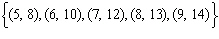 iii) 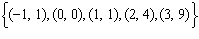 iv) 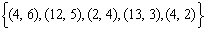
|
|
|
20.
|
Is the slope of this line segment positive, negative, zero, or not
defined? 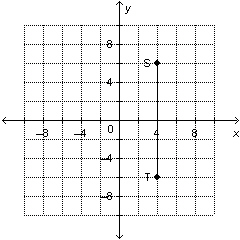 a. | zero | c. | not defined | b. | positive | d. | negative |
|
|
|
21.
|
A line has x-intercept 2 and y-intercept 6? Determine the slope of
the line.
|
|
|
22.
|
Which of these line segments are parallel? 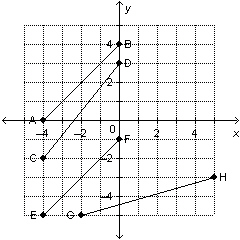 a. | CD and EF | c. | AB and CD | b. | EF and GH | d. | AB and EF |
|
|
|
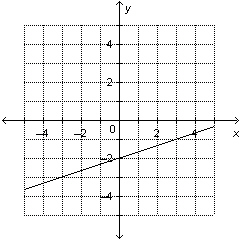
23.
|
Determine the slope and y-intercept of this graph. 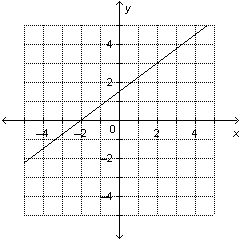 a. | slope:  ; y-intercept: 1.5 ; y-intercept: 1.5 | c. | slope:  ; y-intercept:
–1.5 ; y-intercept:
–1.5 | b. | slope: 1.5; y-intercept:  | d. | slope:  ; y-intercept:
1.5 ; y-intercept:
1.5 |
|
|
|
24.
|
Use the equation  to calculate the value of y when  .
|
|
|
25.
|
Which equations represent parallel lines?
|
|
|
26.
|
Which equations represent perpendicular lines?
|
|
|
27.
|
Describe the graph of the linear function with this equation:  a. | The graph is a line through (–2, 3) with slope  . . | b. | The graph is a line
through (2,  ) with slope ) with slope  . . | c. | The graph is a line
through (2,  ) with slope ) with slope  . . | d. | The graph is a line
through (–2, 3) with slope  . . |
|
|
|
28.
|
Write this equation in slope-intercept form: 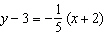
|
|
|
29.
|
Write an equation for the line that passes through T(–3, 3) and is
parallel to the line  .
|
|
|
30.
|
Merny needs a 132-ft. string of outdoor lights. She has m 12-ft. strings
and n 16-ft. strings. Write an equation for the relation.
|
Short Answer
|
|
|
31.
|
Identify the domain and range of this relation. 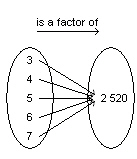
|
|
|
32.
|
Suppose a student drew a graph of each function described below. For which
graphs should the student connect the points?
a) The mass of a
stack of coins is a function of the number of coins.
b) The
temperature in Vancouver is a function of the time of day.
c) The
mass of an animal is a function of its age.
d) The price of a
carton of milk is a function of the size of the carton.
|
|
|
33.
|
This graph shows the volume of gasoline left in a car’s tank, v
litres, as a function of the distance travelled, d in hundreds of kilometres. Determine the
domain and range of the graph. 
|
|
|
34.
|
A treadmill is set with a rise of 9 in. and a run of 90 in. What is the slope of
the treadmill?
|
|
|
35.
|
The slopes of two lines are  and  . Are the two lines
parallel, perpendicular, or neither?
|
|
|
36.
|
Describe the graph of the linear function whose equation is  . .
|
|
|
37.
|
i) Determine the slope and y-intercept of
this graph. ii) Write an equation to describe the
graph.
|
|
|
38.
|
For each equation, identify the slope and y-intercept of its graph. i)
 ii)  iii) 
|
|
|
39.
|
From January 2010 to August 2010, the amount of money in Shannon’s savings
account increased by $75 per month. In May 2010, there was approximately $534 in her savings account.
Write an equation in slope-point form to represent the amount of money in her savings account, s,
as a function of the number of months, n, since December 2009.
|
|
|
40.
|
Write this equation in general form: 
|
Problem
|
|
|
41.
|
For each association below, use the data in the graph to represent a relation as
a set of ordered pairs. a) is the mode of transportation used by this number of students to get to
school b) is the number of students that get to school by  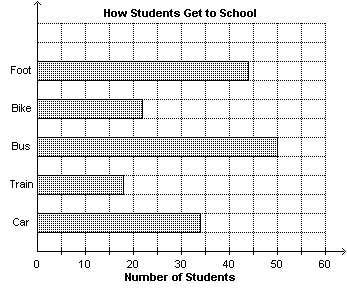
|
|
|
42.
|
Consider the relation represented by this arrow diagram. 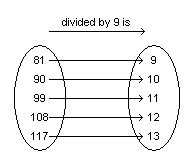 a)
Represent the relation as a set of ordered pairs. b) Does the order of the numbers in each ordered
pair matter? Explain.
|
|
|
43.
|
The equation  represents the total cost, C dollars, for a sports
banquet when g people attend. a) Describe the function. Write the function in function
notation.
b) Determine C(46).
What does this number
represent?
c) Determine the value of g when C(g) = 1581.
What does this number represent?
|
|
|
44.
|
A gas station attracts customers by offering coupons worth $0.03 for every $1.00
spent on gasoline. Value of Gas Purchase, v
($) | Value of Coupons, c
($) | 1 | | 2 | | | | 0.36 | 20 | | | | 1.20 | 50 | | | |
a)
Use function notation to express c as a function of
v. b) Copy and complete the table. c)
What is the value of the coupons a customer will receive if she spends
$80 on gasoline? d) How much does a customer have to spend on
gasoline to receive $5.00 in coupons?
|
|
|
45.
|
This graph represents a day trip from Vancouver to Hope, B.C. The distance
between Vancouver and Hope is approximately 150 km. a)
Describe the journey for each segment of the graph. b) How long
did the day trip take? c) What are the dependent and independent
variables? 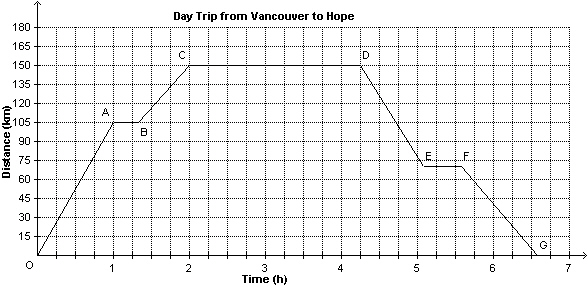
|
|
|
46.
|
This graph shows the number of people, n, at a garage sale as a function
of time, t.  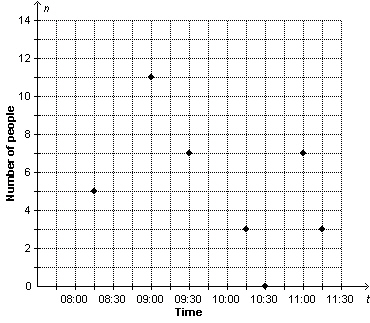 a)
Identify the independent and dependent variables. Justify your choices. b)
Why are the points on the graph not connected? Explain. c)
What is the domain of the graph? d)
What is the range of the graph?
|
|
|
47.
|
Construction workers are paving a road. The road must drop 4 cm for every 650 cm
measured horizontally. a) What is the slope of the road? b) Suppose a section of the road drops 24.5
cm. How long is this section of the road measured horizontally?
|
|
|
48.
|
A line passes through R(6, 9) and K(–6, 15).
a)
What is the slope of line RK?
b)
Line VB is parallel to RK. What is the slope of VB? Explain your answer.
c)
Line WX is perpendicular to RK. What is the slope of WX? Explain your
answer.
|
|
|
49.
|
Students at Tahayghen Secondary School sell punch during the school carnival.
The number of cups sold, n, is a linear function of the temperature in degrees Celsius,
t. The students sold 458 cups when the temperature was 25°C. They sold 534 cups when the
temperature was 29°C. a) Write an equation in slope-point
form to represent this function. b)
Use the equation in part a to determine the approximate temperature when the students sell 325 cups
of punch.
|
|
|
50.
|
Determine the slope of a line that is perpendicular to the line with this
equation: 
|