Multiple Choice
Identify the
choice that best completes the statement or answers the question.
|
|
|
1.
|
Which graph best represents the cost of renting a kayak as a function of
time?
|
|
|
2.
|
Each graph below shows distance, d metres, as a function of time,
t hours. Which graph has a rate of change of 4 m/h and a vertical intercept of 3 m?
|
|
|
3.
|
Each graph below shows distance, d metres, as a function of time,
t hours. Which graph has a rate of change of 0.75 m/h and a horizontal intercept of 3
m?
|
|
|
4.
|
A line passes through D(–5, 3) and N(12, –4). Determine the
coordinates of two points on a line parallel to DN.
a. | (6, –10) and (24, –8) | c. | (–10, 6) and (24,
–8) | b. | (–10, 24) and (6, –8) | d. | (–10, 6) and (–8,
24) |
|
|
|
5.
|
A line passes through R(8, 1) and F(–5, –4). Determine the
coordinates of two points on a line perpendicular to RF.
a. | (16, –11) and (21, 2) | c. | (16, 2) and (21,
–11) | b. | (2, 16) and (21, –11) | d. | (16, 2) and (–11, 21) |
|
|
|
6.
|
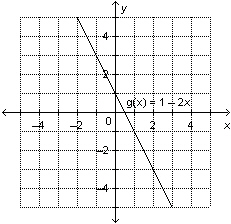
Which graph represents the equation  ?
|
|
|
7.
|
Write an equation in slope-point form for this line. 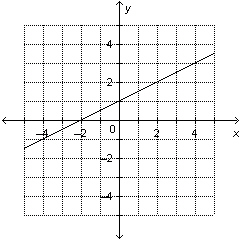
|
|
|
8.
|
Distance travelled, d, is a linear function of time, t. After 75
min. a bus travelled 50 km. After 165 min. the bus travelled 110 km. Write an equation to represent
this function.
|
|
|
9.
|
Write an equation in slope-point form for the line that passes through A(1, 4)
and B(6, 8).
|
|
|
10.
|
Which equation is equivalent to  ?
|
|
|
11.
|
This set of ordered pairs shows the years of some Winter Olympics and the host
city in each year. Represent the relation as a table.
{(1988, Calgary), (1992, Albertville),
(1994, Lillehammer), (1998, Nagano),
(2002, Salt Lake City), (2006, Turin), (2010,
Vancouver)}
|
|
|
12.
|
This table shows the masses, m grams, of different numbers of identical
beads, n. Identify the domain. Number of Beads,
n | Mass of Beads, m
(g) | 1 | 1.56 | 2 | 3.12 | 3 | 4.68 | 4 | 6.24 | 5 | 7.80 | | |
|
|
|
13.
|
For the function  , determine  .
|
|
|
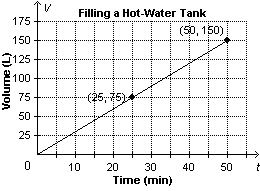
14.
|
The function 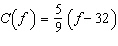 converts a temperature, f degrees Fahrenheit, to
C degrees Celsius. Determine  to the nearest degree.
|
|
|
15.
|
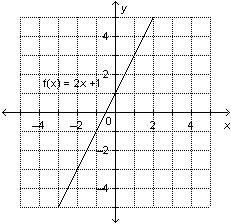
This is a graph of the function  . Determine the domain value when the
range value is –4.
|
|
|
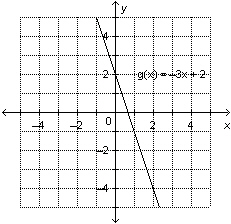
16.
|
This graph represents a 150-L hot-water tank being filled at a constant rate.
Determine the rate of change of the
relation.
 a. | 25 L/min | c. | 75 L/min | b. | 3 L/min | d. | 0.33 L/min |
|
|
|
17.
|
This set of ordered pairs represents a linear relation. Determine its rate of
change. 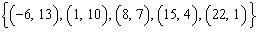
|
|
|
18.
|
Which set of ordered pairs represents a linear relation? i) 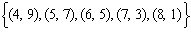 ii) 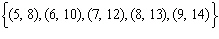 iii) 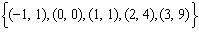 iv) 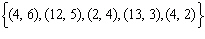
|
|
|
19.
|
This graph shows the fuel consumption of a jeep with a full tank of gas at the
beginning of a journey. When the jeep has travelled 150 km, about how much fuel is left in the
tank? 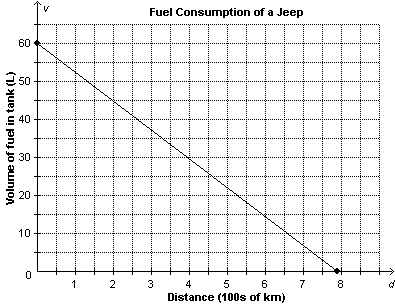 a. | about 49 L | c. | about 51 L | b. | about 12 L | d. | about 11 L |
|
|
|
20.
|
A retirement home ordered canvas shopping bags for 90 residents. This graph
shows the cost of the shopping bags, C dollars, as a function of the number ordered, n.
Suppose one more shopping bag was ordered. What would be the increase in
cost? 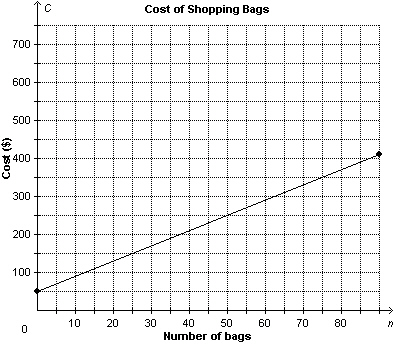 a. | $0.25 | c. | $5.00 | b. | $4.56 | d. | $4.00 |
|
|
|
21.
|
Determine the slope of this line segment. 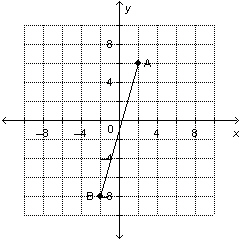
|
|
|
22.
|
The slope of a line is  . What is the slope of a line that is
perpendicular to this line?
|
|
|
23.
|
Determine the slope of a line that is parallel to the line through L(–6,
3) and K(12, –9).
|
|
|
24.
|
A line has x-intercept –5 and y-intercept 1. Determine
the slope of a line parallel to this line.
|
|
|
25.
|
For a service call, a plumber charges a $95 initial fee, plus $45 for each hour
he works. Write an equation to represent the total cost, C dollars, for t hours of
work.
|
|
|
26.
|
Write an equation to describe this graph. 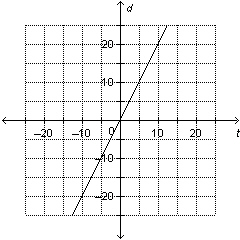
|
|
|
27.
|
Which equations represent perpendicular lines?
|
|
|
28.
|
Write an equation for the line that passes through T(–3, 3) and is
parallel to the line  .
|
|
|
29.
|
Write this equation in general form: 
|
|
|
30.
|
Write this equation in general form: 
|
Short Answer
|
|
|
31.
|
Consider the relation represented by this arrow diagram. Represent the relation
as a set of ordered pairs. 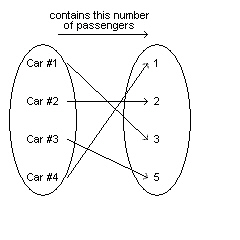
|
|
|
32.
|
The graph shows the speed of a windsurfer as a function of time. 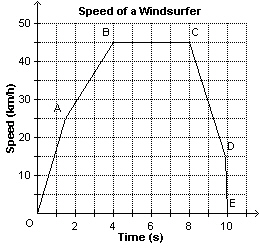 a) For how long did the windsurfer travel at a speed of
45 km/h? b) How long did the windsurfer’s ride
last?
|
|
|
33.
|
This graph shows the volume of gas in a car as a function of time. Describe what
is happening for line segment EF in the graph. 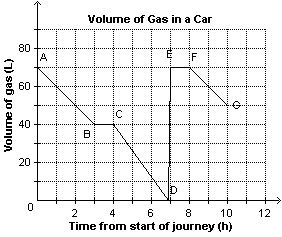
|
|
|
34.
|
This table represents the approximate relation between a distance in miles and
the same distance in kilometres. Determine the rate of change of the relation.. Miles (mi.) | 9 | 18 | 27 | 36 | 45 | Kilometres (km) | 14.4 | 28.8 | 43.2 | 57.6 | 72.0 | | | | | | |
|
|
|
35.
|
This graph shows the volume of gasoline left in a car’s tank, v
litres, as a function of the distance travelled, d in hundreds of kilometres. Determine the
domain and range of the graph. 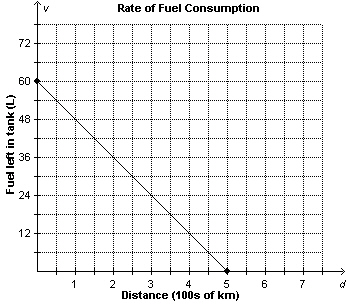
|
|
|
36.
|
Determine the slope of this line segment. 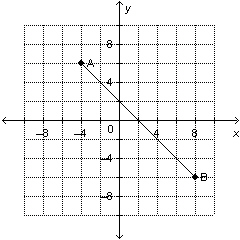
|
|
|
37.
|
The slopes of two lines are  and  . Are the two lines
parallel, perpendicular, or neither?
|
|
|
38.
|
A line has x-intercept –8 and y-intercept 5. Determine the
slope of a line perpendicular to this line.
|
|
|
39.
|
Describe the graph of the linear function whose equation is  . .
|
|
|
40.
|
Write this equation in general form: 
|
Problem
|
|
|
41.
|
Consider the relation represented by this arrow diagram. 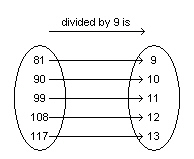 a)
Represent the relation as a set of ordered pairs. b) Does the order of the numbers in each ordered
pair matter? Explain.
|
|
|
42.
|
A gas station attracts customers by offering coupons worth $0.03 for every $1.00
spent on gasoline. Value of Gas Purchase, v
($) | Value of Coupons, c
($) | 1 | | 2 | | | | 0.36 | 20 | | | | 1.20 | 50 | | | |
a)
Use function notation to express c as a function of
v. b) Copy and complete the table. c)
What is the value of the coupons a customer will receive if she spends
$80 on gasoline? d) How much does a customer have to spend on
gasoline to receive $5.00 in coupons?
|
|
|
43.
|
a) This is a graph of the function  .
Determine the range value when the domain value is 2.
 b) This is the graph
of the function  . Determine the range
value when the domain value is
3.
|
|
|
44.
|
The graph represents the cost of printing pamphlets. 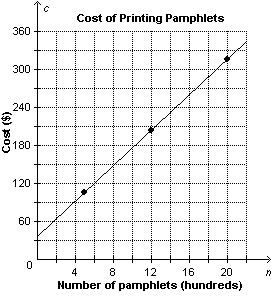 a)
Identify the dependent and independent variables. b)
Sohan calculated the rate of change as follows: Change in cost: 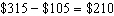 Change in number of pamphlets: 2000 pamphlets – 500 pamphlets = 1500
pamphlets Rate of change: 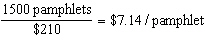 Did he calculate the rate of change correctly?
Explain. c) Describe what the rate of change
represents.
|
|
|
45.
|
This graph shows the distance, d kilometres, from Beijing, China, to
Edmonton, Alberta, as a function of flying time, t hours.  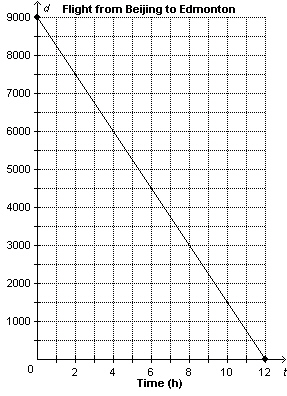 a) Determine the vertical
and horizontal intercepts. Write the coordinates of the points where the graph intersects the axes.
Describe what the points of intersection represent.
b)
Determine the rate of change. What does it represent? c) Write the
domain and range? d) What is the distance to Edmonton when the
plane has been flying for 5 h? e) How many hours has the plane been
flying when the distance to Edmonton is 6500 km?
|
|
|
46.
|
Construction workers are paving a road. The road must drop 4 cm for every 650 cm
measured horizontally. a) What is the slope of the road? b) Suppose a section of the road drops 24.5
cm. How long is this section of the road measured horizontally?
|
|
|
47.
|
In Canada, the number of girls playing organized ice hockey from January 1990 to
January 2010 increased by approximately 4162 girls per year. In January 2000, there were
approximately 45 400 girls playing organized ice hockey. a)
Write an equation in slope-point form to represent the number of
girls, n, playing organized ice hockey as a function of the number of years, t, after
1990.
b) Use the equation in part a to estimate the number of
girls playing organized ice hockey in January 2009.
|
|
|
48.
|
Write an equation for the line that passes through B(–1, 3) and is: a)
parallel to the line  b)
perpendicular to the line 
|
|
|
49.
|
Write an equation in general form for the line that passes through A(3,
–4) and B(11, 8).
|
|
|
50.
|
Charles’s Gas Law states that the volume, v, of a fixed mass of gas
at a constant pressure varies directly with its absolute temperature, t. At 27°C, the
volume of a certain amount of air is 500 mL. When the air is heated to 90°C, the volume
increases to 605 mL.
a) Write an equation in general form for this
relation.
b) Determine the volume of the air when its temperature
is 60°C.
c) Determine the temperature of the air when its
volume is 1010 mL.
|