Multiple Choice
Identify the
choice that best completes the statement or answers the question.
|
|
|
1.
|
This graph shows the height of the tide in a harbour as a function of time in
one day. Which statement best describes the tide at Point C? 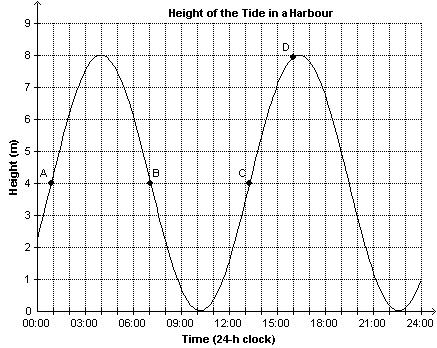 a. | The tide is at its greatest height. | c. | The tide is 7.1 m
high. | b. | The tide is at its least height. | d. | The tide is 4 m
high. |
|
|
|
2.
|
Each graph below shows distance, d metres, as a function of time,
t hours. Which graph has a rate of change of 0.75 m/h and a horizontal intercept of 3
m?
|
|
|
3.
|
A straight section of an Olympic downhill ski course is 34 m long. It drops 16 m
in height. Determine the slope of this part of the course.
|
|
|
4.
|
The slope of a line is  . What is the slope of a line that is
parallel to this line?
|
|
|
5.
|
The slope of a line is  . What is the slope of a line that is
perpendicular to this line?
|
|
|
6.
|
A line passes through J(–10, 10) and K(7, –9). Determine the
coordinates of L so that line JL is perpendicular to line JK.
a. | L(27, 9) | c. | L(17, –19) | b. | L(–19, 17) | d. | L(9, 27) |
|
|
|
7.
|
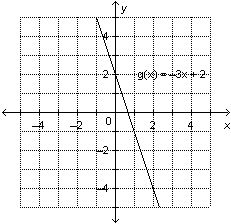
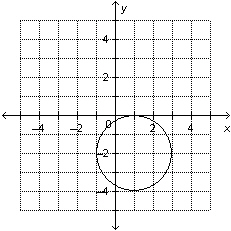
Which graph represents the equation  ?
|
|
|
8.
|
Write an equation in slope-point form for the line that passes through A(1, 4)
and B(6, 8).
|
|
|
9.
|
Which equation is equivalent to  ?
|
|
|
10.
|
A line has x-intercept –9 and y-intercept 3. Determine the
equation of the line in general form.
|
|
|
11.
|
This set of ordered pairs shows the years of some Winter Olympics and the host
city in each year. Represent the relation as a table.
{(1988, Calgary), (1992, Albertville),
(1994, Lillehammer), (1998, Nagano),
(2002, Salt Lake City), (2006, Turin), (2010,
Vancouver)}
|
|
|
12.
|
For the function  , determine  .
|
|
|
13.
|
For the function  , determine x when  .
|
|
|
14.
|
Write 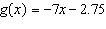 as an equation in two variables.
|
|
|
15.
|
The function 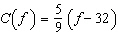 converts a temperature, f degrees Fahrenheit, to
C degrees Celsius. Determine the value of f when  . Give the answer to the
nearest degree. a. | 70°C | b. | –70°C | c. | –29°C | d. | –6°C |
|
|
|
16.
|
Each point on this graph represents a person. Which two people are the same
age? 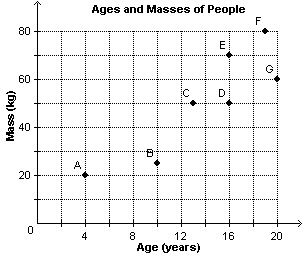 a. | E and F | c. | D and E | b. | C and D | d. | B and C |
|
|
|
17.
|
This graph shows the free-fall speed of a skydiver as a function of time. About
how long did the skydiver’s jump last? 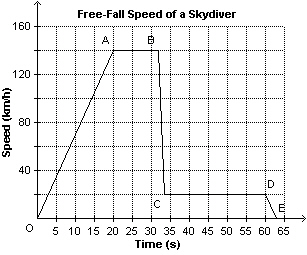 a. | About 20 s | b. | About 13 s | c. | About 60 s | d. | About 63
s |
|
|
|
18.
|
This is a graph of the function  . Determine the domain value when the
range value is –4.
|
|
|
19.
|
Determine the range of the
graph.
|
|
|
20.
|
The altitude of a plane, a metres, is related to the time, t
minutes, that has elapsed since it started its ascent. Determine the rate of change of this linear
relation. t (min) | 0 | 2 | 4 | 6 | 8 | a (m) | 4000 | 5400 | 6800 | 8200 | 9600 | | | | | | |
a. | 1500 m/min | b. | 1400 m/min | c. | 1200 m/min | d. | 700
m/min |
|
|
|
21.
|
This graph shows the cost of a taxi ride. The cost, C dollars, is a
function of the duration of the ride, t min. What is the duration of the ride when the cost is
$35? 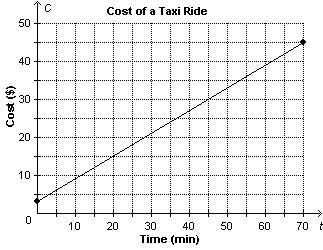 a. | 45 min | c. | 50 min | b. | 58 min | d. | 53 min |
|
|
|
22.
|
Determine the slope of the line that passes through G(3, –3) and
H(–5, 9).
|
|
|
23.
|
Is the slope of this line segment positive, negative, zero, or not
defined? 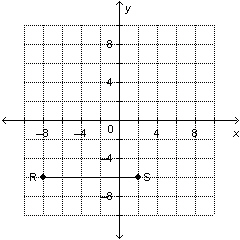 a. | positive | c. | zero | b. | negative | d. | not defined |
|
|
|
24.
|
Determine the slope of the line that passes through G(3, –3) and
H(–6, 15).
|
|
|
25.
|
Determine the slope of the line that is parallel to this line segment. 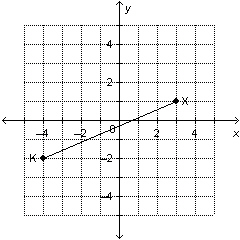
|
|
|
26.
|
The slope of a line is  . What is the slope of a line that is
perpendicular to this line?
|
|
|
27.
|
Write an equation for the graph of a linear function that has slope  and
y-intercept –3.
|
|
|
28.
|
Write an equation to describe this graph. 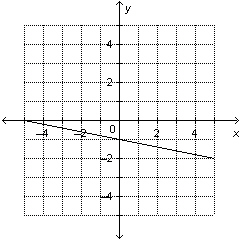
|
|
|
29.
|
Write an equation for the graph of a linear function that has slope 1 and
y-intercept 8.
|
|
|
30.
|
Determine the y-intercept of the graph of this equation:  a. | 3 | c. | 23 | b. |  | d. |  |
|
Short Answer
|
|
|
31.
|
Consider the relation represented by this arrow diagram. Represent the relation
as a set of ordered pairs. 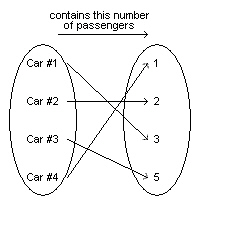
|
|
|
32.
|
This graph shows how the volume of water in a barrel changes over time.
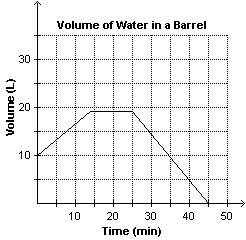 a) About how much water was in the barrel after 25
min? b) After how many minutes was the barrel
empty?
|
|
|
33.
|
This is a graph of the function  .
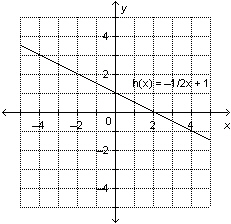 a) Determine the range value
when the domain value is –2. b) Determine the domain value
when the range value is –1.
|
|
|
34.
|
The set of ordered pairs below represents a linear relation. Determine the value
of n. 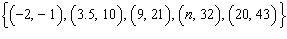
|
|
|
35.
|
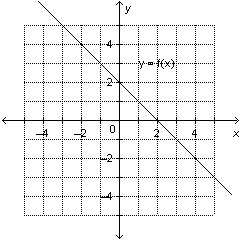
Determine the rate of change and the vertical intercept of this graph.
|
|
|
36.
|
Describe the graph of the linear function whose equation is  . .
|
|
|
37.
|
For each equation, identify the slope and y-intercept of its graph. i)
 ii)  iii) 
|
|
|
38.
|
Write an equation in slope-point form for this line. 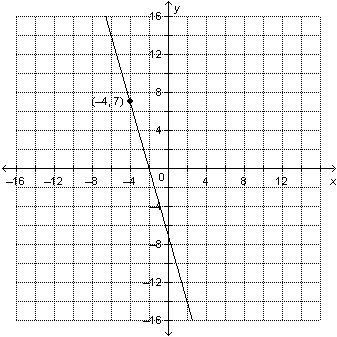
|
|
|
39.
|
Write an equation for the line that passes through E(–3, –7) and
F(2, 10). Write the equation in slope-point form and in slope-intercept form.
|
|
|
40.
|
Write this equation in general form: 
|
Problem
|
|
|
41.
|
Consider the relation represented by this arrow diagram. 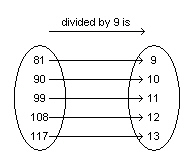 a)
Represent the relation as a set of ordered pairs. b) Does the order of the numbers in each ordered
pair matter? Explain.
|
|
|
42.
|
This table contains information about a women’s hockey team. Use two
columns in this table to represent a relation. a) Name two
relations that are functions. b) Name two relations that are not
functions. Justify your answers. | Team Member | Age | Position | Points | | Julie | 15 | Right Wing | 36 | | Hayley | 16 | Center | 43 | | Cassie | 16 | Left Wing | 38 | | Jennifer | 15 | Left Defence | 17 | | Marie | 17 | Right Wing | 42 | | Meaghan | 15 | Right Defence | 19 | | Angela | 16 | Left Wing | 45 | | Kim | 17 | Center | 37 | | | | |
|
|
|
43.
|
A helicopter is travelling toward its destination. Time (min) | Distance from Destination (mi.) | 0 | 285 | 20 | 244 | 40 | 203 | 60 | 162 | 80 | 121 | | |
a) Identify the
dependent and independent variables. b) Use the table of values to
determine whether the relation is linear. c) If the relation is
linear, determine its rate of change. d)
Assume the helicopter continues to travel at the same speed. How many
more minutes will it take the helicopter to reach its destination? Give your answer to the nearest
minute.
|
|
|
44.
|
This graph represents the relation between the distance a vehicle travels and
the number of revolutions of a tire. An equation for the distance travelled, d metres, after
r revolutions of the tire is  .   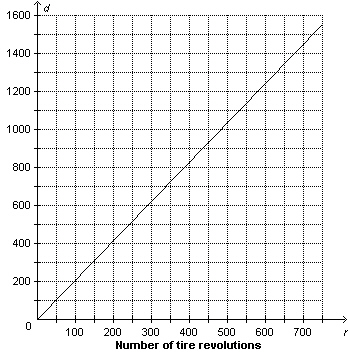 a)
Identify the dependent and independent variables. b)
Does the graph represent a linear relation? How do you
know? c) Describe another strategy you could use to determine
whether this relation is linear.
|
|
|
45.
|
This graph shows the length, l metres, of an object’s shadow as a
function of the height of the object, h metres. 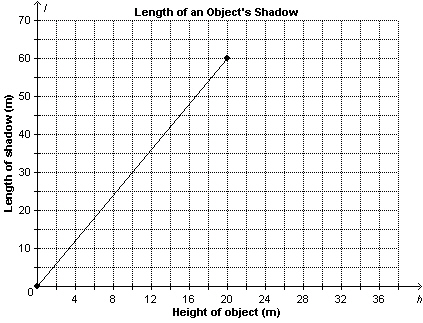 a)
What is the rate of change? What does it represent? b)
A tree has height 13 m. About how long is its shadow? c)
The length of the shadow of a building is 45 m. About how tall is the
building?
|
|
|
46.
|
Four students determined the slope of the line through S(7, –5) and
T(–15, 11). Their answers were:  ,  ,  , and  . Which
answer is correct? How do you know?
|
|
|
47.
|
Construction workers are paving a road. The road must drop 4 cm for every 650 cm
measured horizontally. a) What is the slope of the road? b) Suppose a section of the road drops 24.5
cm. How long is this section of the road measured horizontally?
|
|
|
48.
|
Describe the graph of the linear function whose equation is  . Draw
this graph without using technology.
|
|
|
49.
|
In Canada, the number of girls playing organized ice hockey from January 1990 to
January 2010 increased by approximately 4162 girls per year. In January 2000, there were
approximately 45 400 girls playing organized ice hockey. a)
Write an equation in slope-point form to represent the number of
girls, n, playing organized ice hockey as a function of the number of years, t, after
1990.
b) Use the equation in part a to estimate the number of
girls playing organized ice hockey in January 2009.
|
|
|
50.
|
Determine the slope of a line that is perpendicular to the line with this
equation: 
|