Multiple Choice
Identify the
choice that best completes the statement or answers the question.
|
|
|
1.
|
Which arrow diagram shows the association “is less than” from a set
of numbers to a set of numbers?
|
|
|
2.
|
This graph shows distance, d kilometres, as a function of time, t
minutes. Determine the vertical and horizontal intercepts. 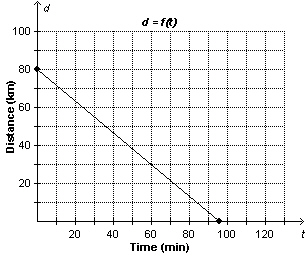
a. | Vertical intercept: 80
Horizontal intercept: 96
| c. | Vertical intercept:
96
Horizontal intercept: 80
| b. | Vertical intercept: 64
Horizontal
intercept: 96
| d. | Vertical
intercept: 80
Horizontal intercept: 64
|
|
|
|
3.
|
This graph shows the volume of water remaining in a leaking hot tub as a
function of time. Determine the domain and range. 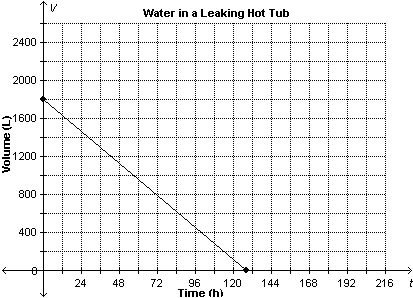
|
|
|
4.
|
This graph represents the time it takes to fill a 140-L hot-water tank.
Determine the volume of water in the tank after 50
min.
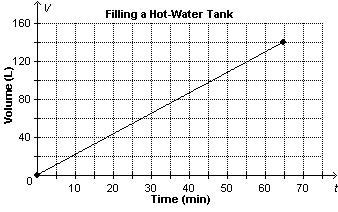 a. | about 23 L | c. | about 119 L | b. | about 97 L | d. | about 108 L |
|
|
|
5.
|
The slope of a line is  . What is the slope of a line that is
perpendicular to this line?
|
|
|
6.
|
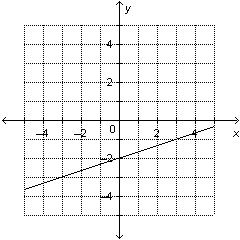
Which graph represents the equation  ?
|
|
|
7.
|
Write an equation in slope-point form for this line. 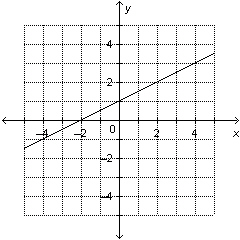
|
|
|
8.
|
Write an equation in slope-point form for the line that passes through
A(–2, 4) and
B(–9, 6).
|
|
|
9.
|
Which equation is written in general form?
|
|
|
10.
|
A line has x-intercept –9 and y-intercept 3. Determine the
equation of the line in general form.
|
|
|
11.
|
This set of ordered pairs shows the heights of 5 students:
{(Sharon, 188
cm), (Petra, 180 cm), (Ammon, 173 cm), (Daniel, 165 cm), (Andrew, 173 cm)}
Represent the relation
as an arrow diagram.
|
|
|
12.
|
The members of the Salvatore family can be associated with their masses, in
kilograms. Consider the relation represented by this set of ordered pairs. Describe the relation in
words.  a. | The relation shows the association “has a mass, in kilograms, of” from a
set of masses to a set of members of the Salvatore family. | b. | The relation shows
the association “has a mass, in grams, of” from a set of members of the Salvatore family
to a set of masses. | c. | The relation shows the association “has a
mass, in kilograms, of” from a set of members of the Salvatore family to a set of
masses. | d. | The relation shows the association “has a height, in kilograms, of” from
a set of members of the Salvatore family to a set of masses. |
|
|
|
13.
|
This table shows the masses, m grams, of different numbers of identical
beads, n. Identify the domain. Number of Beads,
n | Mass of Beads, m
(g) | 1 | 1.56 | 2 | 3.12 | 3 | 4.68 | 4 | 6.24 | 5 | 7.80 | | |
|
|
|
14.
|
This table shows the cost, C dollars, of different numbers of tickets
sold, n. Identify the range. Number of Tickets,
n | Cost, C
($) | 1 | 12.50 | 2 | 25.00 | 3 | 37.50 | 4 | 50.00 | 5 | 62.50 | | |
|
|
|
15.
|
Write  as an equation in two variables.
|
|
|
16.
|
The function 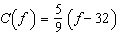 converts a temperature, f degrees Fahrenheit, to
C degrees Celsius. Determine  to the nearest degree.
|
|
|
17.
|
Each point on this graph represents a person. Which two people are the same
age? 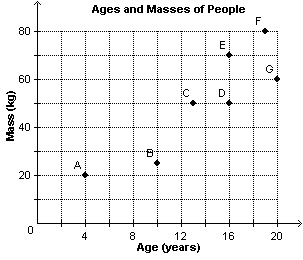 a. | E and F | c. | D and E | b. | C and D | d. | B and C |
|
|
|
18.
|
Joshua went on a bike ride. During the ride, he stopped to play at a park, as
shown by line segment CD. How much time did Joshua spend at the park? 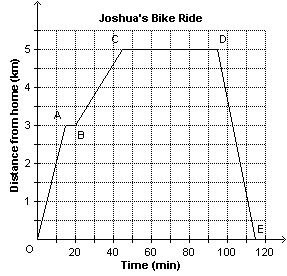 a. | 65 min. | b. | 75 min. | c. | 70 min. | d. | 80
min. |
|
|
|
19.
|
This graph shows the height of the tide in a harbour as a function of time in
one day. What is the greatest height of the tide? 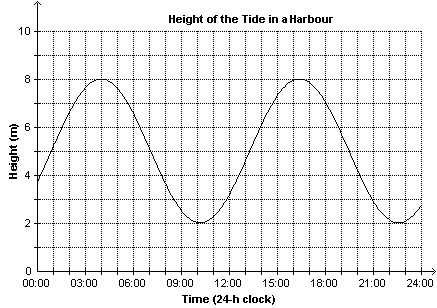
|
|
|
20.
|
This graph shows the free-fall speed of a skydiver as a function of time. At
what speed was the skydiver travelling 10 s before she reached the ground? 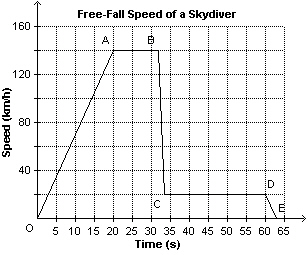 a. | 20 km/h | b. | 140 km/h | c. | 30 km/h | d. | 10
km/h |
|
|
|
21.
|
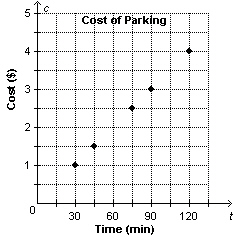
This graph shows the cost of parking, c, as a function of time, t.
Determine the domain of the
graph.
|
|
|
22.
|
Which table of values represents a linear relation? i) | Distance (m) | 0 | 5 | 10 | 15 | 20 | | Time (s) | 0 | 1 | 2 | 3 | 4 | | | | | | |
ii)
| Time (s) | 0 | 3 | 6 | 9 | 12 | | Distance (m) | 0 | 10 | 22 | 36 | 52 | | | | | | |
iii)
| Time (s) | 0 | 1 | 2 | 3 | 4 | | Speed (m/s) | 0 | 1 | 2 | 4 | 8 | | | | | | |
iv)
| Distance (m) | 0 | 4 | 16 | 36 | 64 | | Speed (m/s) | 0 | 2 | 4 | 6 | 8 | | | | | | |
|
|
|
23.
|
Which of these line segments are parallel? 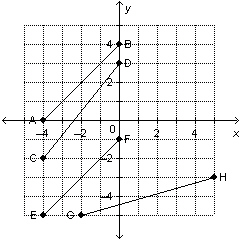 a. | CD and EF | c. | AB and CD | b. | EF and GH | d. | AB and EF |
|
|
|
24.
|
The slope of a line is  . What is the slope of a line that is
perpendicular to this line?
|
|
|
25.
|
Determine the slope of a line that is parallel to the line through L(–6,
3) and K(12, –9).
|
|
|
26.
|
Write an equation to describe this graph. 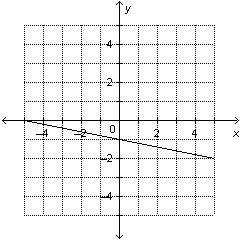
|
|
|
27.
|
Determine the slope and y-intercept of this graph. 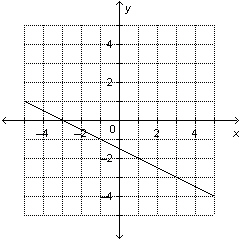 a. | slope:  ; y-intercept: –1.5 ; y-intercept: –1.5 | c. | slope:  ;
y-intercept: 1.5 ;
y-intercept: 1.5 | b. | slope:  ; y-intercept:
1.5 ; y-intercept:
1.5 | d. | slope:  ;
y-intercept: –1.5 ;
y-intercept: –1.5 |
|
|
|
28.
|
Write this equation in slope-intercept form: 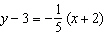
|
|
|
29.
|
Determine the y-intercept of the graph of this equation:  a. |  | c. |  | b. | 13 | d. | 3 |
|
|
|
30.
|
Write an equation for the line that passes through U(3, –7) and is
perpendicular to the line  .
|
Short Answer
|
|
|
31.
|
Different coloured game pieces can be associated with their lengths, in
centimetres. Consider the relation represented by this arrow diagram. Represent the relation as a
graph.  
|
|
|
32.
|
a) Write in function notation:  b)
Write as an equation in two variables: 
|
|
|
33.
|
A school plans to build a wheelchair ramp from the sidewalk to the front
entrance of the school. The slope of the ramp must be  . The entrance to the school is 75 cm
above the ground. What is the horizontal distance needed for the ramp?
|
|
|
34.
|
The slopes of two lines are  and  . Are the two lines
parallel, perpendicular, or neither?
|
|
|
35.
|
The slopes of two lines are  and  . Are the two lines
parallel, perpendicular, or neither?
|
|
|
36.
|
Describe the graph of the linear function whose equation is  . .
|
|
|
37.
|
i) Determine the slope and y-intercept of
this graph. ii) Write an equation to describe the
graph.
|
|
|
38.
|
For each equation, identify the slope and y-intercept of its graph. i)
 ii)  iii) 
|
|
|
39.
|
Determine the slope of the line of this equation: 
|
|
|
40.
|
a) Determine the x- and
y-intercepts of the graph of this equation:  b)
Graph the equation. 
|
Problem
|
|
|
41.
|
For each association below, use the data in the graph to represent a relation as
a set of ordered pairs. a) is the mode of transportation used by this number of students to get to
school b) is the number of students that get to school by  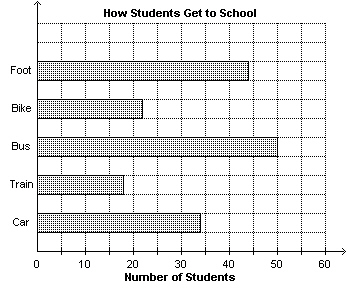
|
|
|
42.
|
A relation contains 5 elements in the domain and 6 elements in the range. Can
this relation be a function? Justify your answer.
|
|
|
43.
|
Four litres of latex paint covers approximately 37 m 2 and costs
$52. a) Copy and complete this table. | Volume of Paint, p
(L) | 0 | 4 | 8 | 12 | 16 | | Cost, c ($) | 0 | 52 | | | | | Area Covered, A (m2) | 0 | 37 | | | | | | | | | |
b) Graph the area covered as a
function of the volume of paint.  c) Graph the area covered
as a function of the cost.  d) Write the domain and
range of the functions in parts b and c.
|
|
|
44.
|
Sketch a graph of a function that has domain  and range  . 
|
|
|
45.
|
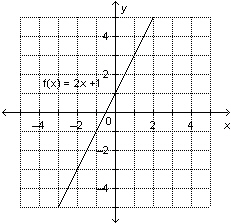
a) This is a graph of the function  .
Determine the range value when the domain value is 2.
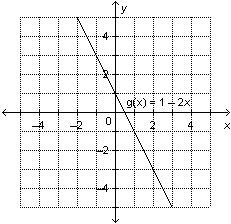
 b) This is the graph
of the function  . Determine the range
value when the domain value is
3.
|
|
|
46.
|
A helicopter is travelling toward its destination. Time (min) | Distance from Destination (mi.) | 0 | 285 | 20 | 244 | 40 | 203 | 60 | 162 | 80 | 121 | | |
a) Identify the
dependent and independent variables. b) Use the table of values to
determine whether the relation is linear. c) If the relation is
linear, determine its rate of change. d)
Assume the helicopter continues to travel at the same speed. How many
more minutes will it take the helicopter to reach its destination? Give your answer to the nearest
minute.
|
|
|
47.
|
This graph shows the distance, d kilometres, from Beijing, China, to
Edmonton, Alberta, as a function of flying time, t hours.   a) Determine the vertical
and horizontal intercepts. Write the coordinates of the points where the graph intersects the axes.
Describe what the points of intersection represent.
b)
Determine the rate of change. What does it represent? c) Write the
domain and range? d) What is the distance to Edmonton when the
plane has been flying for 5 h? e) How many hours has the plane been
flying when the distance to Edmonton is 6500 km?
|
|
|
48.
|
a) Determine the rise, run, and slope of this line segment. 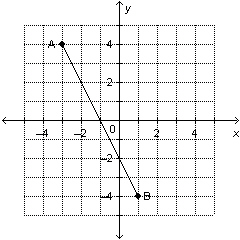 b) Draw a line segment whose slope is: i)
zero ii) not defined iii) the
same as the slope of the line segment in part a 
|
|
|
49.
|
Reggie says FGHJ is a parallelogram. Ann says FGHJ is a rectangle. Who is
correct? Justify your answer. 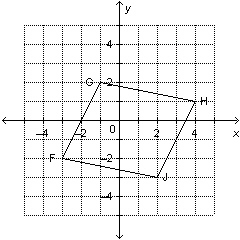
|
|
|
50.
|
The coordinates of the vertices of DGBW are G(20,
10), B(–35, 20), and W(5, –10). Is DGBW a right triangle?
Justify your answer.
|