Multiple Choice
Identify the
choice that best completes the statement or answers the question.
|
|
|
1.
|
Which ordered pair belongs to the relation shown in the diagram below? 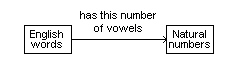 a. | (function, 4) | c. | (relation, 4) | b. | (arrow, 4) | d. | (mathematics,
2) |
|
|
|
2.
|
Gail leaves the house for her morning jog. She stops for a quick drink, then
continues jogging before stopping again to chat with a friend. She then jogs back home. Which graph
best represents Gail’s run?
|
|
|
3.
|
Which graph best represents the cost of renting a kayak as a function of
time?
|
|
|
4.
|
Each graph below shows distance, d metres, as a function of time,
t hours. Which graph has a rate of change of 4 m/h and a vertical intercept of 3 m?
|
|
|
5.
|
A line passes through J(–10, 10) and K(7, –9). Determine the
coordinates of L so that line JL is perpendicular to line JK.
a. | L(27, 9) | c. | L(17, –19) | b. | L(–19, 17) | d. | L(9, 27) |
|
|
|
6.
|
A line passes through R(8, 1) and F(–5, –4). Determine the
coordinates of two points on a line perpendicular to RF.
a. | (16, –11) and (21, 2) | c. | (16, 2) and (21,
–11) | b. | (2, 16) and (21, –11) | d. | (16, 2) and (–11, 21) |
|
|
|
7.
|
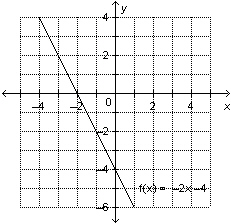
Which graph represents the equation  ?
|
|
|
8.
|
Which graph represents the equation  ?
|
|
|
9.
|
Which equation is written in general form?
|
|
|
10.
|
Which graph represents the equation  ?
|
|
|
11.
|
Which set of ordered pairs does not represent a function? i) 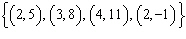 ii) 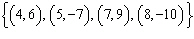 iii) 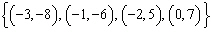 iv) 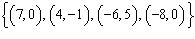
|
|
|
12.
|
Identify the domain of this relation. 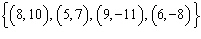
|
|
|
13.
|
Identify the range of this relation. 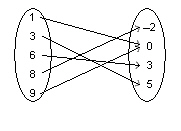
|
|
|
14.
|
Write  as an equation in two variables.
|
|
|
15.
|
This graph shows the free-fall speed of a skydiver as a function of time. About
how long did the skydiver’s jump last? 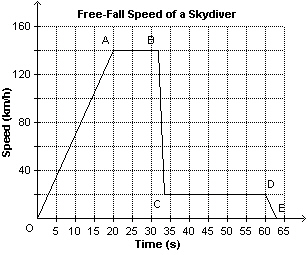 a. | About 20 s | b. | About 13 s | c. | About 60 s | d. | About 63
s |
|
|
|
16.
|
Which of these graphs represents a
function? i)
ii) 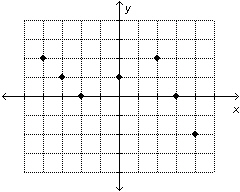  iii)
iv)  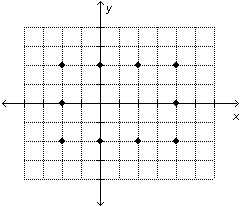
|
|
|
17.
|
This is a graph of the function  . Determine the domain value when the
range value is
–2.
|
|
|
18.
|
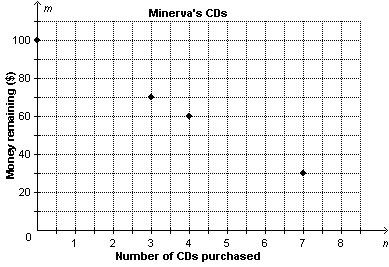
Minerva has $100. This graph represents the money Minerva would have if she
purchased different numbers of CDs. Determine the rate of change of the relation.
|
|
|
19.
|
The relation between x and y is linear. Which ordered pair
completes this table of values?
a. | (–5, –16) | c. | (–13, –5) | b. | (–16,
–5) | d. | (–5,
–13) |
|
|
|
20.
|
Which set of ordered pairs represents a linear relation? i) 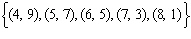 ii) 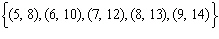 iii) 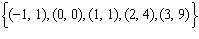 iv) 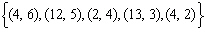
|
|
|
21.
|
Determine the slope of this line segment. 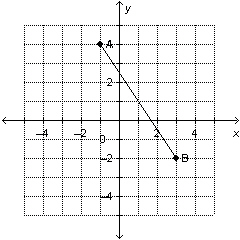
|
|
|
22.
|
Determine the slope of the line that is perpendicular to this line
segment. 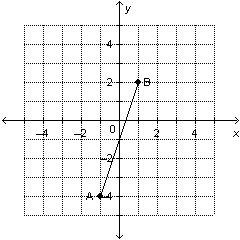
|
|
|
23.
|
Determine the slope of the line that is parallel to this line segment. 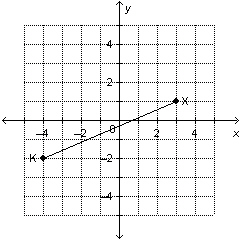
|
|
|
24.
|
The slope of a line is  . What is the slope of a line that is
perpendicular to this line?
|
|
|
25.
|
A line has x-intercept 4 and y-intercept –5. Determine the
slope of a line perpendicular to this line.
|
|
|
26.
|
Write an equation for the graph of a linear function that has slope  and
y-intercept –3.
|
|
|
27.
|
To join a tennis club, Josephine pays a start-up fee of $130, plus a monthly fee
of $24. Write an equation to represent the total cost, C dollars, for t months of
membership.
|
|
|
28.
|
Write an equation to describe this graph. 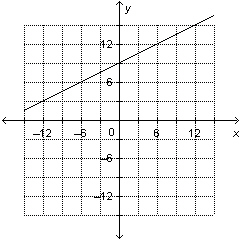
|
|
|
29.
|
Determine the x-intercept and the y-intercept for the graph of
this equation:  a. | x-intercept: 18; y-intercept: 12 | c. | x-intercept: 18;
y-intercept:  | b. | x-intercept:  ; y-intercept: ; y-intercept:  | d. | x-intercept:  ; y-intercept: 12 ; y-intercept: 12 |
|
|
|
30.
|
Determine the slope of the line with this equation:  a. | –4 | c. |  | b. |  | d. | 4 |
|
Short Answer
|
|
|
31.
|
Identify the domain and range of this relation. 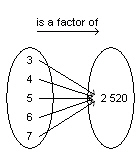
|
|
|
32.
|
Which equations represent linear relations? Create tables of values if
necessary. a) 
d)  b) 
e)  c) 
f) 
|
|
|
33.
|
This table represents the approximate relation between a distance in miles and
the same distance in kilometres. Determine the rate of change of the relation.. Miles (mi.) | 9 | 18 | 27 | 36 | 45 | Kilometres (km) | 14.4 | 28.8 | 43.2 | 57.6 | 72.0 | | | | | | |
|
|
|
34.
|
This graph shows cost, C dollars, as a function of time, t hours.
What is the time when the cost is $35? 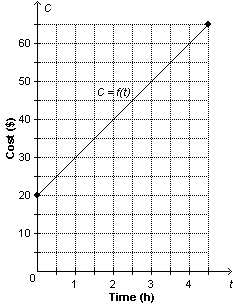
|
|
|
35.
|
Determine the slope of this line segment. 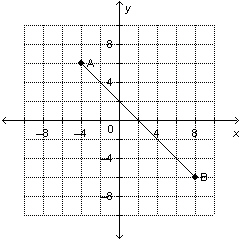
|
|
|
36.
|
A 10-ft. ladder leans against a wall. The base of the ladder is on level ground
6 ft. from the wall. What is the slope of the ladder?
|
|
|
37.
|
Describe the graph of the linear function whose equation is  . .
|
|
|
38.
|
Graph the line with y-intercept 3 and slope –2 .

|
|
|
39.
|
Write this equation in general form: 
|
|
|
40.
|
Desmond works as a babysitter for two families. Family A pays $5.75 per hour.
Family B pays $7.5 per hour. Last weekend, Desmond earned $75. Write an equation in general form for
the relation.
|
Problem
|
|
|
41.
|
For this table of values: a) Graph the data.
Will you join the points? Justify your answer. b) Does the graph
represent a function? Explain? Number of People, n | Cost,
C
($) | 15 | 0.50 | 30 | 1.00 | 60 | 2.00 | 90 | 3.00 | 120 | 4.00 | | |
|
|
|
42.
|
This table shows the speed of a hot air balloon at different time intervals
after lift off. A student drew a graph to represent the data in the table. Time, t
(s) | Speed, S
(m/s) | 0 | 0 | 1 | 2.4 | 2 | 5.6 | 3 | 10.0 | 4 | 12.4 | 6 | 15.0 | 9 | 16.1 | 10 | 16.1 | | |
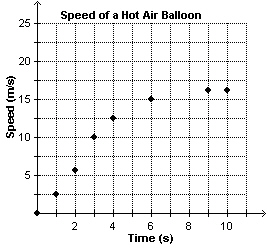 a)
Describe any errors in the graph. b) Is this relation a function?
Explain.
|
|
|
43.
|
Four litres of latex paint covers approximately 37 m 2 and costs
$52. a) Copy and complete this table. | Volume of Paint, p
(L) | 0 | 4 | 8 | 12 | 16 | | Cost, c ($) | 0 | 52 | | | | | Area Covered, A (m2) | 0 | 37 | | | | | | | | | |
b) Graph the area covered as a
function of the volume of paint.  c) Graph the area covered
as a function of the cost.  d) Write the domain and
range of the functions in parts b and c.
|
|
|
44.
|
This graph shows the length, l metres, of an object’s shadow as a
function of the height of the object, h metres. 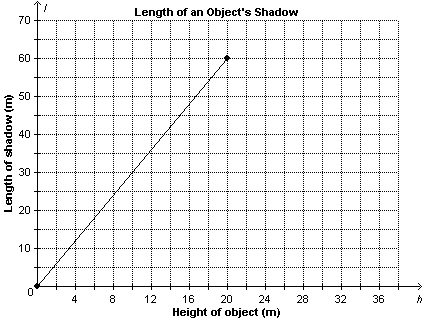 a)
What is the rate of change? What does it represent? b)
A tree has height 13 m. About how long is its shadow? c)
The length of the shadow of a building is 45 m. About how tall is the
building?
|
|
|
45.
|
A guy wire helps to support a tower. One end of the wire is 25 m from the base
of the tower. The wire has a slope of  . How high up the tower does the wire reach?
|
|
|
46.
|
Four students determined the slope of the line through S(7, –5) and
T(–15, 11). Their answers were:  ,  ,  , and  . Which
answer is correct? How do you know?
|
|
|
47.
|
Reggie says FGHJ is a parallelogram. Ann says FGHJ is a rectangle. Who is
correct? Justify your answer. 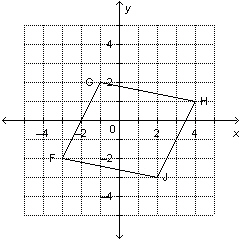
|
|
|
48.
|
In Canada, the number of girls playing organized ice hockey from January 1990 to
January 2010 increased by approximately 4162 girls per year. In January 2000, there were
approximately 45 400 girls playing organized ice hockey. a)
Write an equation in slope-point form to represent the number of
girls, n, playing organized ice hockey as a function of the number of years, t, after
1990.
b) Use the equation in part a to estimate the number of
girls playing organized ice hockey in January 2009.
|
|
|
49.
|
Students at Tahayghen Secondary School sell punch during the school carnival.
The number of cups sold, n, is a linear function of the temperature in degrees Celsius,
t. The students sold 458 cups when the temperature was 25°C. They sold 534 cups when the
temperature was 29°C. a) Write an equation in slope-point
form to represent this function. b)
Use the equation in part a to determine the approximate temperature when the students sell 325 cups
of punch.
|
|
|
50.
|
Graph this equation:  Describe the strategies you
used. 
|