Multiple Choice
Identify the
choice that best completes the statement or answers the question.
|
|
|
1.
|
Each graph below shows distance, d metres, as a function of time,
t hours. Which graph has a rate of change of 0.75 m/h and a horizontal intercept of 3
m?
|
|
|
2.
|
This graph shows the cost of gas. The cost, C dollars, is a function of
the volume, V litres , of gas purchased. What is the volume of gas purchased when the
cost is $10.45?
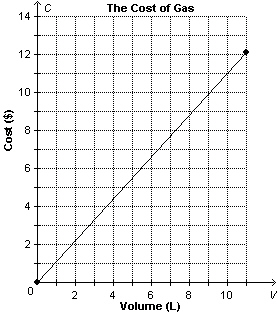 a. | about 11.5 L | c. | about 9.5 L | b. | about 10.5 L | d. | about 9 L |
|
|
|
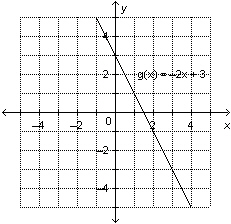
3.
|
A straight section of an Olympic downhill ski course is 34 m long. It drops 16 m
in height. Determine the slope of this part of the course.
|
|
|
4.
|
Which set of ordered pairs does not represent a function? i)  ii)  iii)  iv) 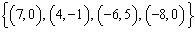
|
|
|
5.
|
Identify the range of this relation. 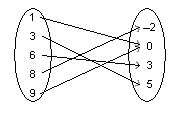
|
|
|
6.
|
For the function  , determine  .
|
|
|
7.
|
Write  in function notation.
|
|
|
8.
|
The function 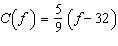 converts a temperature, f degrees Fahrenheit, to
C degrees Celsius. Determine the value of f when  . Give the answer to the
nearest degree. a. | 70°C | b. | –70°C | c. | –29°C | d. | –6°C |
|
|
|
9.
|
Determine the domain and range of this
graph.
|
|
|
10.
|
Determine the domain and range of the graph of this
function.
|
|
|
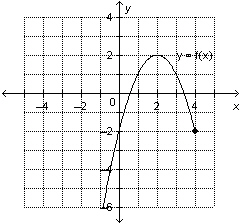
11.
|
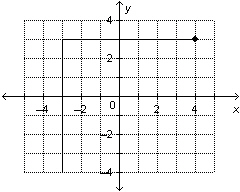
This is a graph of the function  . Determine the range value when the
domain value is 2.
|
|
|
12.
|
This is a graph of the function  . Determine the domain value when the
range value is –4.
|
|
|
13.
|
This is a graph of the function  . Determine the domain value when the
range value is
–2.
|
|
|
14.
|
A bathtub contains 40 L of water. The plug is pulled. This graph shows the
volume of water remaining in the tub, v, as a function of time, t. What is a
restriction on the
range?
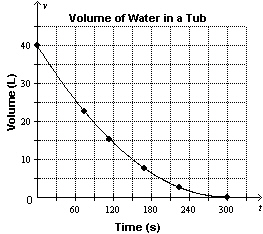 a. | The range can only contain negative numbers. | b. | The range cannot
contain negative numbers. | c. | The range can only contain whole numbers up to
40. | d. | The range can only contain whole numbers greater than
40. |
|
|
|
15.
|
The graph shows the height of a float plane as it descends to land. Determine
the rate of change for this graph. 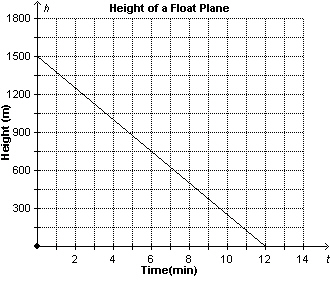 a. | –125 m/min | c. | 125 m/min | b. | –0.008 m/min | d. | –1500
m/min |
|
|
|
16.
|
This graph shows the fuel consumption of a jeep with a full tank of gas at the
beginning of a journey. When the jeep has travelled 150 km, about how much fuel is left in the
tank? 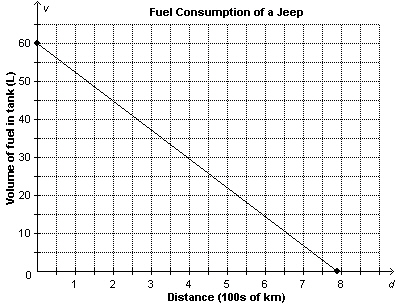 a. | about 49 L | c. | about 51 L | b. | about 12 L | d. | about 11 L |
|
|
|
17.
|
A retirement home ordered canvas shopping bags for 90 residents. This graph
shows the cost of the shopping bags, C dollars, as a function of the number ordered, n.
Suppose one more shopping bag was ordered. What would be the increase in
cost? 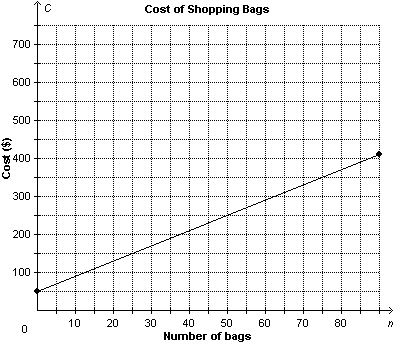 a. | $0.25 | c. | $5.00 | b. | $4.56 | d. | $4.00 |
|
|
|
18.
|
Is the slope of this line segment positive, negative, zero, or not
defined? 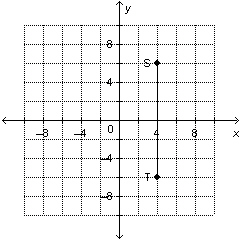 a. | zero | c. | not defined | b. | positive | d. | negative |
|
|
|
19.
|
Is the slope of this line segment positive, negative, zero, or not
defined? 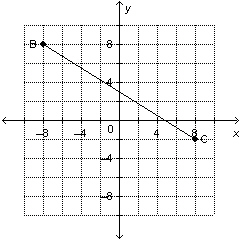 a. | negative | c. | positive | b. | not defined | d. | zero |
|
|
|
20.
|
A skateboard ramp rises 2 ft. for every 7 ft. measured horizontally. What is the
run?
a. |  | c. | 2 | b. | 7 | d. |  |
|
Short Answer
|
|
|
21.
|
Identify the domain and range of this relation. 
|
|
|
22.
|
This graph shows the cost, C dollars, of printing an advertising flyer
for the school play as a function of the number of flyers printed, n. What is the cost when
1000 flyers are printed? 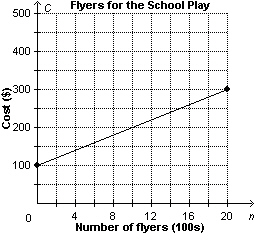
|
|
|
23.
|
This graph shows cost, C dollars, as a function of time, t hours.
What is the time when the cost is $35? 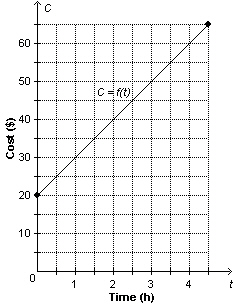
|
|
|
24.
|
Determine the slope of this line segment. 
|
|
|
25.
|
A school plans to build a wheelchair ramp from the sidewalk to the front
entrance of the school. The slope of the ramp must be  . The entrance to the school is 75 cm
above the ground. What is the horizontal distance needed for the ramp?
|
Problem
|
|
|
26.
|
A gas station attracts customers by offering coupons worth $0.03 for every $1.00
spent on gasoline. Value of Gas Purchase, v
($) | Value of Coupons, c
($) | 1 | | 2 | | | | 0.36 | 20 | | | | 1.20 | 50 | | | |
a)
Use function notation to express c as a function of
v. b) Copy and complete the table. c)
What is the value of the coupons a customer will receive if she spends
$80 on gasoline? d) How much does a customer have to spend on
gasoline to receive $5.00 in coupons?
|
|
|
27.
|
This graph shows the number of people, n, at a garage sale as a function
of time, t.  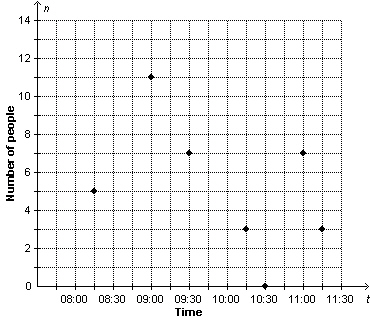 a)
Identify the independent and dependent variables. Justify your choices. b)
Why are the points on the graph not connected? Explain. c)
What is the domain of the graph? d)
What is the range of the graph?
|
|
|
28.
|
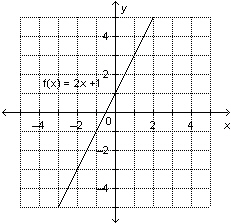
a) This is a graph of the function  .
Determine the range value when the domain value is 2.
 b) This is the graph
of the function  . Determine the range
value when the domain value is
3.
|
|
|
29.
|
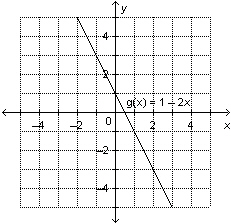
Sketch a graph of the linear function  . 
|
|
|
30.
|
This graph shows the distance, d kilometres, from Beijing, China, to
Edmonton, Alberta, as a function of flying time, t hours.  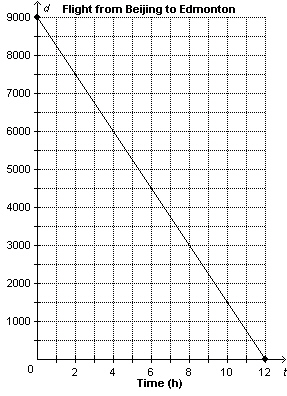 a) Determine the vertical
and horizontal intercepts. Write the coordinates of the points where the graph intersects the axes.
Describe what the points of intersection represent.
b)
Determine the rate of change. What does it represent? c) Write the
domain and range? d) What is the distance to Edmonton when the
plane has been flying for 5 h? e) How many hours has the plane been
flying when the distance to Edmonton is 6500 km?
|