Multiple Choice
Identify the
choice that best completes the statement or answers the question.
|
|
|
1.
|
This graph shows distance, d kilometres, as a function of time, t
minutes. Determine the vertical and horizontal intercepts. 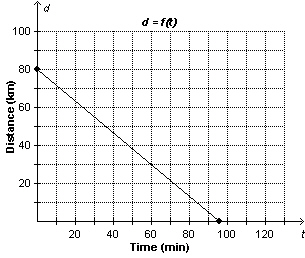
a. | Vertical intercept: 80
Horizontal intercept: 96
| c. | Vertical intercept:
96
Horizontal intercept: 80
| b. | Vertical intercept: 64
Horizontal
intercept: 96
| d. | Vertical
intercept: 80
Horizontal intercept: 64
|
|
|
|
2.
|
Each graph below shows distance, d metres, as a function of time,
t hours. Which graph has a rate of change of 4 m/h and a vertical intercept of 3 m?
|
|
|
3.
|
Which line segment has slope  ?
|
|
|
4.
|
This table shows the masses, m grams, of different numbers of identical
beads, n. Identify the domain. Number of Beads,
n | Mass of Beads, m
(g) | 1 | 1.56 | 2 | 3.12 | 3 | 4.68 | 4 | 6.24 | 5 | 7.80 | | |
|
|
|
5.
|
This table shows the cost, C dollars, of different numbers of tickets
sold, n. Identify the range. Number of Tickets,
n | Cost, C
($) | 1 | 12.50 | 2 | 25.00 | 3 | 37.50 | 4 | 50.00 | 5 | 62.50 | | |
|
|
|
6.
|
For the function  , determine x when  .
|
|
|
7.
|
Write  as an equation in two variables.
|
|
|
8.
|
Write 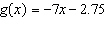 as an equation in two variables.
|
|
|
9.
|
The function 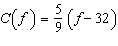 converts a temperature, f degrees Fahrenheit, to
C degrees Celsius. Determine  to the nearest degree.
|
|
|
10.
|
Identify the independent variable and the dependent variable for this table of
values. Hours Worked,
h | Gross Pay, P ($) | 4 | 38.00 | 5 | 47.50 | 9 | 85.50 | 20 | 190.00 | 30 | 285.00 | | |
a. | independent variable: P
dependent variable: h | c. | independent
variable: gross pay
dependent variable: hours worked | b. | independent
variable: domain
dependent variable: range | d. | independent variable: hours worked
dependent
variable: gross pay |
|
|
|
11.
|
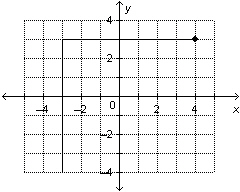
Which of these graphs represents a
function? i)
ii) 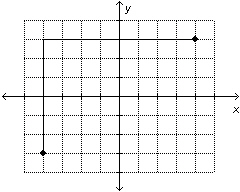 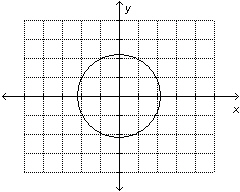 iii)
iv) 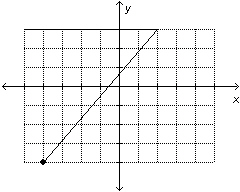 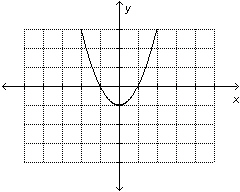
|
|
|
12.
|
Determine the domain and range of this
graph.
|
|
|
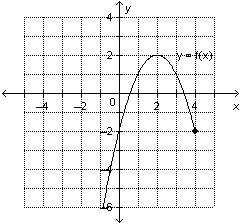
13.
|
Determine the domain and range of the graph of this
function.
|
|
|
14.
|
Determine the domain of this
graph.
|
|
|
15.
|
This graph shows a person’s distance from a starting point, d
kilometres, as a function of time, t minutes. Determine the distance from the starting
point when the time is 5 min. 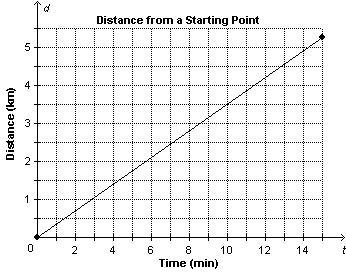 a. | about 10.1 km | c. | about 1.8 km | b. | about 14.3 km | d. | about 0.6 km |
|
|
|
16.
|
Determine the slope of the line that passes through G(3, –3) and
H(–5, 9).
|
|
|
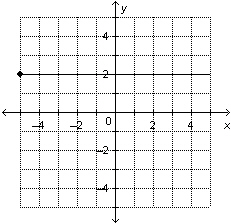
17.
|
Is the slope of this line segment positive, negative, zero, or not
defined? 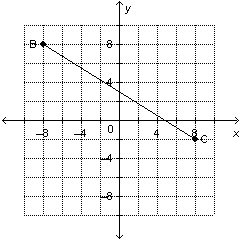 a. | negative | c. | positive | b. | not defined | d. | zero |
|
|
|
18.
|
Determine the steepness of this roof by calculating its slope. 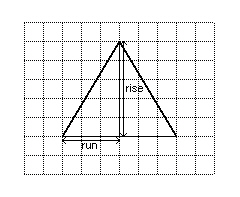
|
|
|
19.
|
A road rises 9 m for every 60 m measured horizontally. Determine the slope of
the road.
|
|
|
20.
|
A skateboard ramp rises 2 ft. for every 7 ft. measured horizontally. What is the
run?
a. |  | c. | 2 | b. | 7 | d. |  |
|
Short Answer
|
|
|
21.
|
This graph shows the speed of a windsurfer, s, as a function of time,
t. Why are the points on the graph connected? 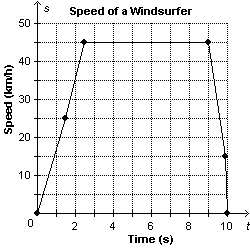
|
|
|
22.
|
Determine the vertical and horizontal intercepts of this graph. 
|
|
|
23.
|
Determine the rate of change and the vertical intercept of this graph.
|
|
|
24.
|
Determine the slope of this line segment. 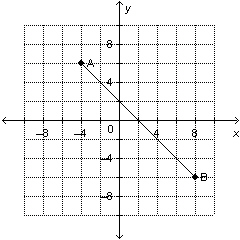
|
|
|
25.
|
A school plans to build a wheelchair ramp from the sidewalk to the front
entrance of the school. The slope of the ramp must be  . The entrance to the school is 75 cm
above the ground. What is the horizontal distance needed for the ramp?
|
Problem
|
|
|
26.
|
Four litres of latex paint covers approximately 37 m 2 and costs
$52. a) Copy and complete this table. | Volume of Paint, p
(L) | 0 | 4 | 8 | 12 | 16 | | Cost, c ($) | 0 | 52 | | | | | Area Covered, A (m2) | 0 | 37 | | | | | | | | | |
b) Graph the area covered as a
function of the volume of paint.  c) Graph the area covered
as a function of the cost.  d) Write the domain and
range of the functions in parts b and c.
|
|
|
27.
|
This graph shows the length, l metres, of an object’s shadow as a
function of the height of the object, h metres. 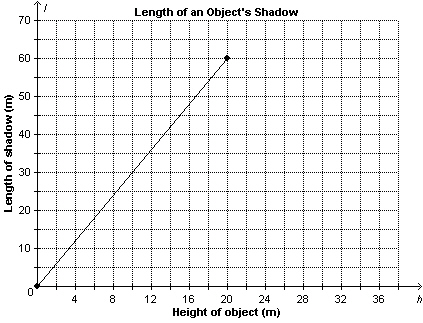 a)
What is the rate of change? What does it represent? b)
A tree has height 13 m. About how long is its shadow? c)
The length of the shadow of a building is 45 m. About how tall is the
building?
|
|
|
28.
|
Sketch a graph of the linear function  . 
|
|
|
29.
|
This graph shows the distance, d kilometres, from Beijing, China, to
Edmonton, Alberta, as a function of flying time, t hours.  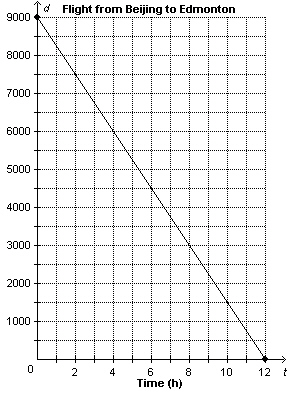 a) Determine the vertical
and horizontal intercepts. Write the coordinates of the points where the graph intersects the axes.
Describe what the points of intersection represent.
b)
Determine the rate of change. What does it represent? c) Write the
domain and range? d) What is the distance to Edmonton when the
plane has been flying for 5 h? e) How many hours has the plane been
flying when the distance to Edmonton is 6500 km?
|
|
|
30.
|
Four students determined the slope of the line through S(7, –5) and
T(–15, 11). Their answers were:  ,  ,  , and  . Which
answer is correct? How do you know?
|