Multiple Choice
Identify the
choice that best completes the statement or answers the question.
|
|
|
1.
|
Which arrow diagram shows the association “is less than” from a set
of numbers to a set of numbers?
|
|
|
2.
|
Gail leaves the house for her morning jog. She stops for a quick drink, then
continues jogging before stopping again to chat with a friend. She then jogs back home. Which graph
best represents Gail’s run?
|
|
|
3.
|
This set of ordered pairs shows the years of some Winter Olympics and the host
city in each year. Represent the relation as a table.
{(1988, Calgary), (1992, Albertville),
(1994, Lillehammer), (1998, Nagano),
(2002, Salt Lake City), (2006, Turin), (2010,
Vancouver)}
|
|
|
4.
|
Different colours of marbles can be associated with the number of marbles in a
bag. Consider the relation represented by this arrow diagram. Represent the relation as a
graph. 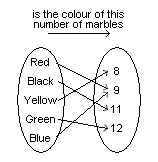
|
|
|
5.
|
This graph shows the free-fall speed of a skydiver as a function of time. About
how long did the skydiver’s jump last?  a. | About 20 s | b. | About 13 s | c. | About 60 s | d. | About 63
s |
|
|
|
6.
|
This graph shows the free-fall speed of a skydiver as a function of time. Which
statement best describes what is happening for line segment BC in the graph? 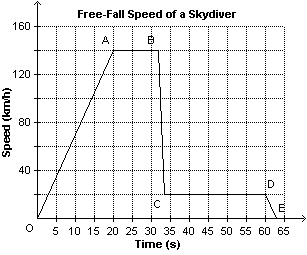 a. | The skydiver landed on the ground. | b. | The skydiver opened her
parachute. | c. | The skydiver was free-falling. | d. | The skydiver jumped out of the
plane. |
|
|
|
7.
|
Which table of values represents a linear relation? i) | Distance (m) | 0 | 5 | 10 | 15 | 20 | | Time (s) | 0 | 1 | 2 | 3 | 4 | | | | | | |
ii)
| Time (s) | 0 | 3 | 6 | 9 | 12 | | Distance (m) | 0 | 10 | 22 | 36 | 52 | | | | | | |
iii)
| Time (s) | 0 | 1 | 2 | 3 | 4 | | Speed (m/s) | 0 | 1 | 2 | 4 | 8 | | | | | | |
iv)
| Distance (m) | 0 | 4 | 16 | 36 | 64 | | Speed (m/s) | 0 | 2 | 4 | 6 | 8 | | | | | | |
|
|
|
8.
|
This table of values represents a linear relation. Determine the rate of change
of the relation. Time (s) | 0 | 1 | 2 | 3 | 4 | Distance (m) | 0 | 5 | 10 | 15 | 20 | | | | | | |
a. | 5 m/s | b. | 10 m/s | c. | 2 m/s | d. | 1
m/s |
|
|
|
9.
|
The monthly income, I dollars, of a furniture salesperson is given by the
equation  , where s represents the salesperson’s total monthly sales in dollars.
Determine the rate of change of this linear
relation.
a. | 0.03 | c. | 1500 | b. |  | d. | 3 |
|
|
|
10.
|
For a service call, an electrician charges a $65 flat fee, plus $45 for every 30
min worked. Determine the rate of change of this linear
relation.
a. | $45/h | c. | $65/h | b. | $110/h | d. | $90/h |
|
Short Answer
|
|
|
11.
|
Countries can be associated with the year they won gold in Olympic Men’s
Ice Hockey. Consider the relation represented by this table. Describe this relation in
words. | Country | Year | | United States | 1980 | | Soviet Union | 1984 | | Soviet Union | 1988 | | CIS | 1992 | | Sweden | 1994 | | Czech Republic | 1998 | | Canada | 2002 | | Sweden | 2006 | | Canada | 2010 | | |
|
|
|
12.
|
The set of ordered pairs below shows Aboriginal ice-hockey players who have
played in the NHL and their heritage. Represent the relation as a table.
{(Jordin Tootoo,
Inuit), (Jonathan Cheechoo, Moose Cree), (Sheldon Souray, Metis),
(Wade Redden, Metis), (Chris
Simon, Ojibwa), (Sandy McCarthy, Mi’kmaq)}
|
|
|
13.
|
This graph shows how the volume of water in a barrel changes over time.
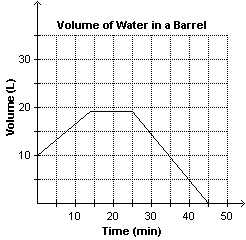 a) About how much water was in the barrel after 25
min? b) After how many minutes was the barrel
empty?
|
|
|
14.
|
Natasha spent part of the afternoon running errands. This graph shows her
distance from home as a function of time. 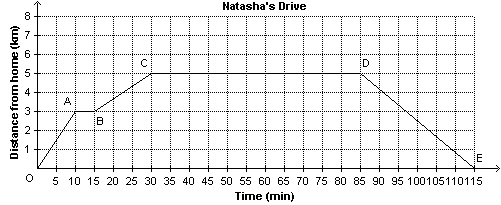 a)
How far did Natasha drive in total? b) How long was Natasha away
from home?
|
|
|
15.
|
Which equations represent linear relations? Create tables of values if
necessary. a) 
d)  b) 
e)  c) 
f) 
|
Problem
|
|
|
16.
|
A student drew a graph to represent this situation. “Lenora starts
her 3.5-km walk home from school. After walking 1 km in 20 min, she stops to talk to a friend. She
talks for 10 min and then continues walking at the same pace. Fifteen minutes later, she stops for 5
min to rest. She starts walking at the same pace again and after 15 min, she decides to jog the rest
of the way home.” Describe any errors in the student’s graph. Sketch the correct
graph. 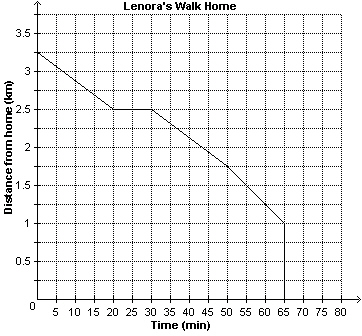 
|
|
|
17.
|
For this table of values: a) Graph the data.
Will you join the points? Justify your answer. b) Does the graph
represent a function? Explain? Number of People, n | Cost,
C
($) | 15 | 0.50 | 30 | 1.00 | 60 | 2.00 | 90 | 3.00 | 120 | 4.00 | | |
|
|
|
18.
|
A bathtub contains 40 L of water. The plug is pulled. The volume of water
remaining in the tub is recorded at various intervals. Time
(s) | Volume
(L) | 0 | 40.0 | 55 | 26.7 | 105 | 16.9 | 170 | 7.5 | 225 | 2.5 | 300 | 0.0 | | |
Graph the data. Show volume as a function of
time. Will you join the points? Explain. 
|
|
|
19.
|
This graph represents the relation between the distance a vehicle travels and
the number of revolutions of a tire. An equation for the distance travelled, d metres, after
r revolutions of the tire is  .   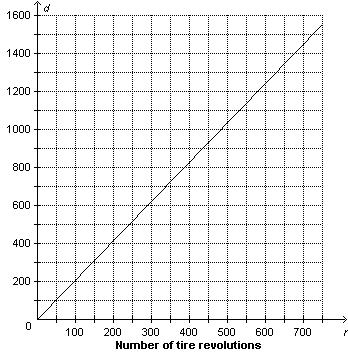 a)
Identify the dependent and independent variables. b)
Does the graph represent a linear relation? How do you
know? c) Describe another strategy you could use to determine
whether this relation is linear.
|