Multiple Choice
Identify the
choice that best completes the statement or answers the question.
|
|
|
1.
|
A person in a car drives away from a stop sign, cruises at a constant speed, and
then slows down as she approaches another stop sign. Which graph best represents this
situation?
|
|
|
2.
|
Which graph best represents the cost of renting a kayak as a function of
time?
|
|
|
3.
|
Consider the relation represented by this arrow diagram. Represent the relation
as a set of ordered pairs. 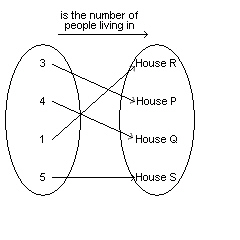 a. | {(House P, 1), (House Q, 3), (House R, 4), (House S, 5)} | b. | {(3, House P), (4,
House Q), (1, House R), (5, House S)} | c. | {(1, House P), (3, House Q), (4, House R), (5,
House S)} | d. | {(House P, 3), (House Q, 4), (House R, 1), (House S,
5)} |
|
|
|
4.
|
Consider the relation represented by this graph. Represent the relation as a set
of ordered pairs. 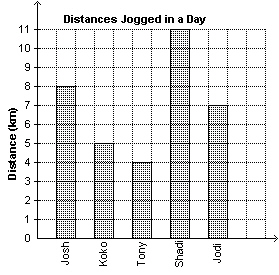  a. | {(Josh, 8), (Koko, 5), (Tony, 4), (Shadi, 11), (Jodi, 7)} | b. | {(8, Josh), (5,
Koko), (Tony, 4), (11, Shadi), (Jodi, 7)} | c. | {(8, Josh), (5, Koko), (4, Tony), (11, Shadi),
(7, Jodi)} | d. | {(Josh, 8), (Koko, 5), (Tony, 4), (Shadi, 7), (Jodi,
11)} |
|
|
|
5.
|
In this diagram, describe the relation in words. 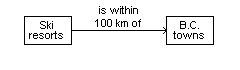 a. | The relation shows the association “is about 100 km” from a set of ski
resorts to a set of towns in B.C. | b. | The relation shows the association “is
within 100 km of” from a set of ski resorts to a set of towns in B.C. | c. | The relation shows
the association “is within 100 km of” from a set of towns in B.C. to a set of ski
resorts. | d. | The relation shows the association “is 100 km away” from a set of ski
resorts to a set of towns in B.C. |
|
|
|
6.
|
Joshua went on a bike ride. During the ride, he stopped to play at a park, as
shown by line segment CD. How much time did Joshua spend at the park? 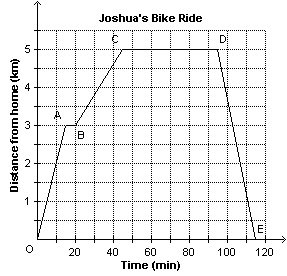 a. | 65 min. | b. | 75 min. | c. | 70 min. | d. | 80
min. |
|
|
|
7.
|
This graph shows the height of the tide in a harbour as a function of time in
one day. What is the greatest height of the tide? 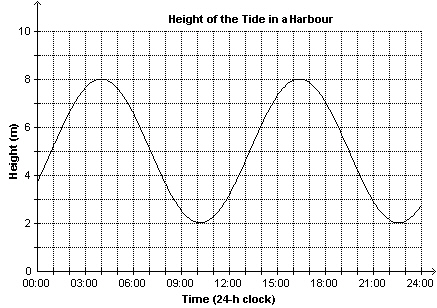
|
|
|
8.
|
This graph shows the free-fall speed of a skydiver as a function of time. At
what speed was the skydiver travelling 10 s before she reached the ground? 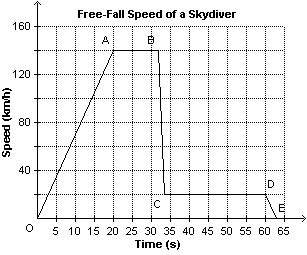 a. | 20 km/h | b. | 140 km/h | c. | 30 km/h | d. | 10
km/h |
|
|
|
9.
|
The altitude of a plane, a metres, is related to the time, t
minutes, that has elapsed since it started its ascent. Determine the rate of change of this linear
relation. t (min) | 0 | 2 | 4 | 6 | 8 | a (m) | 4000 | 5400 | 6800 | 8200 | 9600 | | | | | | |
a. | 1500 m/min | b. | 1400 m/min | c. | 1200 m/min | d. | 700
m/min |
|
|
|
10.
|
Which set of ordered pairs represents a linear relation? i) 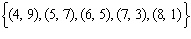 ii) 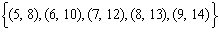 iii) 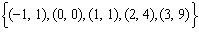 iv) 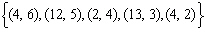
|
Short Answer
|
|
|
11.
|
Natasha spent part of the afternoon running errands. This graph shows her
distance from home as a function of time. 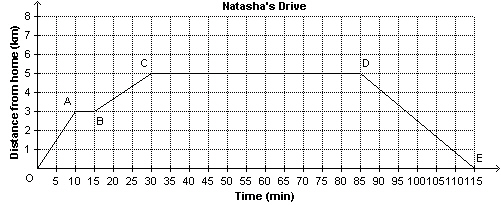 a)
How far did Natasha drive in total? b) How long was Natasha away
from home?
|
|
|
12.
|
This table shows the refund, r dollars, for different numbers of pop
cans, n. Write the domain and range. Number of Pop Cans,
n | Refund, r
($) | 9 | 0.45 | 13 | 0.65 | 16 | 0.80 | 24 | 1.20 | 33 | 1.65 | | |
|
|
|
13.
|
Explain why the points on this graph are not joined.  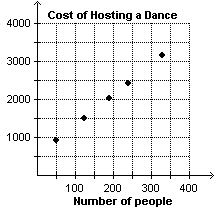
|
|
|
14.
|
Which equations represent linear relations? Create tables of values if
necessary. a) 
d)  b) 
e)  c) 
f) 
|
|
|
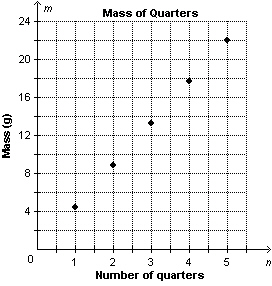
15.
|
A quarter has a mass of 4.4 g. This graph represents the mass of a stack of
quarters as a function of the number of quarters in the stack. Identify the independent and dependent
variables.
|
Problem
|
|
|
16.
|
Here are some families and the number of days they spent camping last
summer. Jones (2); Smith (6); Teynor (9); Glimler (11); Frannot (16) a) Describe the
relation in words. b) Represent the relation: i) as an arrow
diagram
ii) as a table
|
|
|
17.
|
This table shows the speed of a hot air balloon at different time intervals
after lift off. A student drew a graph to represent the data in the table. Time, t
(s) | Speed, S
(m/s) | 0 | 0 | 1 | 2.4 | 2 | 5.6 | 3 | 10.0 | 4 | 12.4 | 6 | 15.0 | 9 | 16.1 | 10 | 16.1 | | |
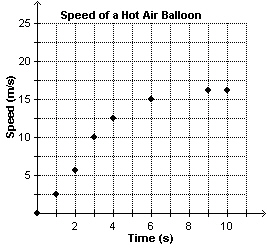 a)
Describe any errors in the graph. b) Is this relation a function?
Explain.
|
|
|
18.
|
The graph represents the cost of printing pamphlets. 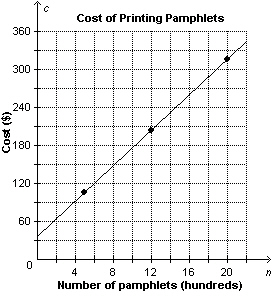 a)
Identify the dependent and independent variables. b)
Sohan calculated the rate of change as follows: Change in cost:  Change in number of pamphlets: 2000 pamphlets – 500 pamphlets = 1500
pamphlets Rate of change: 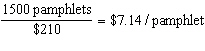 Did he calculate the rate of change correctly?
Explain. c) Describe what the rate of change
represents.
|
|
|
19.
|
A skydiver jumps from an altitude of 3700 m. For the first 12 s, her height in
metres above the ground is described by this set of ordered pairs: 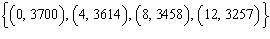 . Between 18 s and 36 s,
her height above the ground is described by this set of ordered pairs: 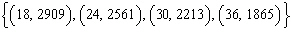 . Determine whether
either set of ordered pairs represents a linear relation. Explain.
|