Multiple Choice
Identify the
choice that best completes the statement or answers the question.
|
|
|
1.
|
A person in a car drives away from a stop sign, cruises at a constant speed, and
then slows down as she approaches another stop sign. Which graph best represents this
situation?
|
|
|
2.
|
Which graph best represents the cost of renting a kayak as a function of
time?
|
|
|
3.
|
In this diagram, describe the relation in words. 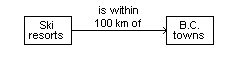 a. | The relation shows the association “is about 100 km” from a set of ski
resorts to a set of towns in B.C. | b. | The relation shows the association “is
within 100 km of” from a set of ski resorts to a set of towns in B.C. | c. | The relation shows
the association “is within 100 km of” from a set of towns in B.C. to a set of ski
resorts. | d. | The relation shows the association “is 100 km away” from a set of ski
resorts to a set of towns in B.C. |
|
|
|
4.
|
Joshua went on a bike ride. For part of the ride, Joshua stopped to play in a
park with a friend. Which segment of the graph best describes this part of his bike ride? 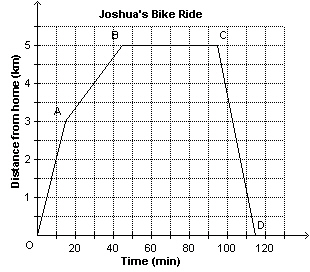
|
|
|
5.
|
Joshua went on a bike ride. Which statement best describes what is happening for
line segment DE in this graph? 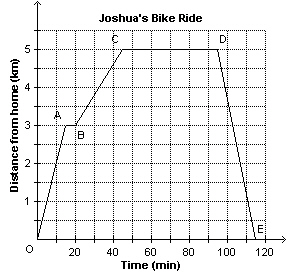 a. | Joshua spends time at the park. | b. | Joshua leaves home. | c. | Joshua cycles to the
park. | d. | Joshua returns home. |
|
|
|
6.
|
This graph shows the free-fall speed of a skydiver as a function of time. About
how long did the skydiver’s jump last? 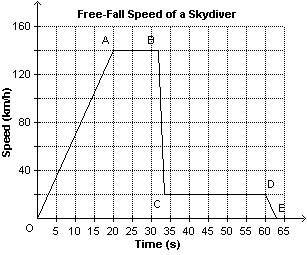 a. | About 20 s | b. | About 13 s | c. | About 60 s | d. | About 63
s |
|
|
|
7.
|
This graph shows the free-fall speed of a skydiver as a function of time. Which
statement best describes what is happening for line segment BC in the graph?  a. | The skydiver landed on the ground. | b. | The skydiver opened her
parachute. | c. | The skydiver was free-falling. | d. | The skydiver jumped out of the
plane. |
|
|
|
8.
|
The relation between x and y is linear. Which number would
complete this table?
|
|
|
9.
|
The monthly income, I dollars, of a furniture salesperson is given by the
equation  , where s represents the salesperson’s total monthly sales in dollars.
Determine the rate of change of this linear
relation.
a. | 0.03 | c. | 1500 | b. |  | d. | 3 |
|
|
|
10.
|
Which situation represents a linear relation?
i) The number of cells decays
at a rate of 12% each day.
ii) A taxi company charges a $3 flat fee plus $1 for each kilometre
travelled.
iii) A
population of bacteria doubles every hour for 6 h.
iv) An investor’s portfolio increases in
value by 6% each year.
|
Short Answer
|
|
|
11.
|
Consider the relation represented by this arrow diagram. Represent the relation
as a set of ordered pairs. 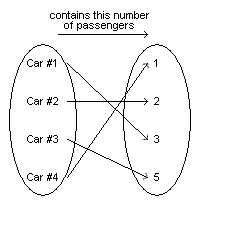
|
|
|
12.
|
Consider the relation represented by this set of ordered pairs. 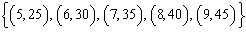 Describe
the relation in words.
|
|
|
13.
|
The set of ordered pairs below shows Aboriginal ice-hockey players who have
played in the NHL and their heritage. Represent the relation as a table.
{(Jordin Tootoo,
Inuit), (Jonathan Cheechoo, Moose Cree), (Sheldon Souray, Metis),
(Wade Redden, Metis), (Chris
Simon, Ojibwa), (Sandy McCarthy, Mi’kmaq)}
|
|
|
14.
|
Explain why the points on this graph are not joined.  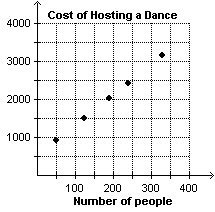
|
|
|
15.
|
This table represents the approximate relation between a distance in miles and
the same distance in kilometres. Determine the rate of change of the relation.. Miles (mi.) | 9 | 18 | 27 | 36 | 45 | Kilometres (km) | 14.4 | 28.8 | 43.2 | 57.6 | 72.0 | | | | | | |
|
Problem
|
|
|
16.
|
Here are some families and the number of days they spent camping last
summer. Jones (2); Smith (6); Teynor (9); Glimler (11); Frannot (16) a) Describe the
relation in words. b) Represent the relation: i) as an arrow
diagram
ii) as a table
|
|
|
17.
|
A student drew a graph to represent this situation. “Lenora starts
her 3.5-km walk home from school. After walking 1 km in 20 min, she stops to talk to a friend. She
talks for 10 min and then continues walking at the same pace. Fifteen minutes later, she stops for 5
min to rest. She starts walking at the same pace again and after 15 min, she decides to jog the rest
of the way home.” Describe any errors in the student’s graph. Sketch the correct
graph. 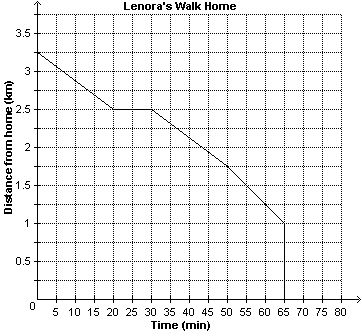 
|
|
|
18.
|
A helicopter is travelling toward its destination. Time (min) | Distance from Destination (mi.) | 0 | 285 | 20 | 244 | 40 | 203 | 60 | 162 | 80 | 121 | | |
a) Identify the
dependent and independent variables. b) Use the table of values to
determine whether the relation is linear. c) If the relation is
linear, determine its rate of change. d)
Assume the helicopter continues to travel at the same speed. How many
more minutes will it take the helicopter to reach its destination? Give your answer to the nearest
minute.
|
|
|
19.
|
A skydiver jumps from an altitude of 3700 m. For the first 12 s, her height in
metres above the ground is described by this set of ordered pairs: 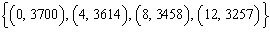 . Between 18 s and 36 s,
her height above the ground is described by this set of ordered pairs: 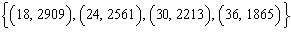 . Determine whether
either set of ordered pairs represents a linear relation. Explain.
|