Multiple Choice
Identify the
choice that best completes the statement or answers the question.
|
|
|
1.
|
Which arrow diagram shows the association “is less than” from a set
of numbers to a set of numbers?
|
|
|
2.
|
Which graph best represents the cost of renting a kayak as a function of
time?
|
|
|
3.
|
This set of ordered pairs shows the years of some Winter Olympics and the host
city in each year. Represent the relation as a table.
{(1988, Calgary), (1992, Albertville),
(1994, Lillehammer), (1998, Nagano),
(2002, Salt Lake City), (2006, Turin), (2010,
Vancouver)}
|
|
|
4.
|
Each point on this graph represents an animal. Which animal has the least
mass? 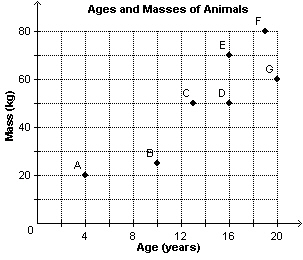
|
|
|
5.
|
This graph shows the height of the tide in a harbour as a function of time in
one day. What is the greatest height of the tide? 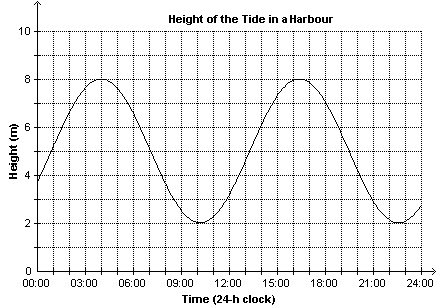
|
|
|
6.
|
This graph shows the free-fall speed of a skydiver as a function of time. Which
statement best describes what is happening for line segment BC in the graph? 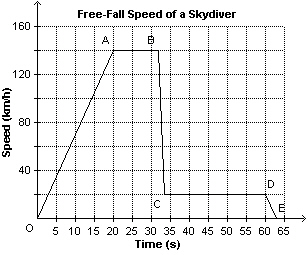 a. | The skydiver landed on the ground. | b. | The skydiver opened her
parachute. | c. | The skydiver was free-falling. | d. | The skydiver jumped out of the
plane. |
|
|
|
7.
|
The altitude of a plane, a metres, is related to the time, t
minutes, that has elapsed since it started its ascent. Determine the rate of change of this linear
relation. t (min) | 0 | 2 | 4 | 6 | 8 | a (m) | 4000 | 5400 | 6800 | 8200 | 9600 | | | | | | |
a. | 1500 m/min | b. | 1400 m/min | c. | 1200 m/min | d. | 700
m/min |
|
|
|
8.
|
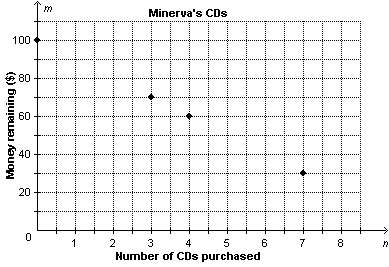
Minerva has $100. This graph represents the money Minerva would have if she
purchased different numbers of CDs. Determine the rate of change of the relation.
|
|
|
9.
|
This set of ordered pairs represents a linear relation. Determine its rate of
change. 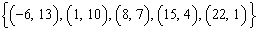
|
|
|
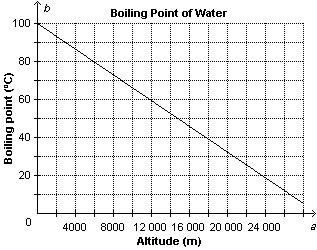
10.
|
This graph represents the boiling point of water, b degrees Celsius, as a
function of altitude, a metres. Identify the independent
variable.
|
Short Answer
|
|
|
11.
|
Different coloured game pieces can be associated with their lengths, in
centimetres. Consider the relation represented by this arrow diagram. Represent the relation as a
graph. 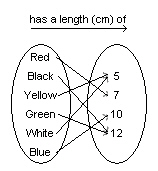 
|
|
|
12.
|
The graph shows the speed of a windsurfer as a function of time. 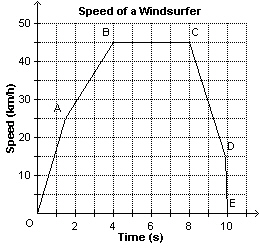 a) For how long did the windsurfer travel at a speed of
45 km/h? b) How long did the windsurfer’s ride
last?
|
|
|
13.
|
The graph shows the height of the tide in a harbour as a function of time in one
day. About how high is the tide at 2 p.m., to the nearest metre? 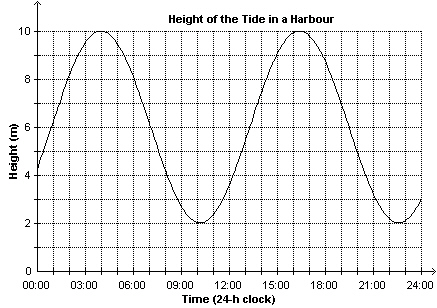
|
|
|
14.
|
This graph shows the volume of gas in a car as a function of time. Describe what
is happening for line segment EF in the graph. 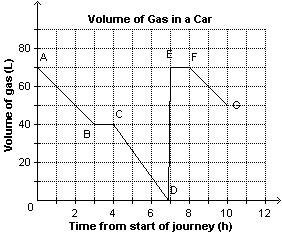
|
|
|
15.
|
Suppose you were to graph the data in this table of values. Would you join the
points? Justify your answer. Number of Pop Bottles, n | Refund, r
($) | 5 | 1.00 | 12 | 2.40 | 17 | 3.40 | 24 | 4.80 | 30 | 6.00 | | |
|
Problem
|
|
|
16.
|
For each association below, use the data in the graph to represent a relation as
a set of ordered pairs. a) is the mode of transportation used by this number of students to get to
school b) is the number of students that get to school by  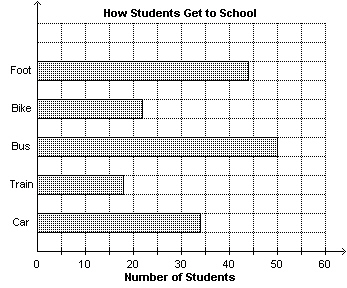
|
|
|
17.
|
An oven is turned on at a room temperature of 20 °C and it takes 10 min to reach a temperature of 190 °C. A cake is placed in the oven to bake for 30 min. The oven is then
turned off and returns to room temperature after 15 min. The oven is turned on again 45 min later and
it takes 15 min to reach a temperature of 160 °C. Cookies are placed
in the oven to bake for 20 min. The oven is then turned off and returns to room temperature after 15
min. Sketch a graph of temperature as a function of time. Label each section of the graph and explain
what it represents. 
|
|
|
18.
|
A student drew a graph to represent this situation. “Lenora starts
her 3.5-km walk home from school. After walking 1 km in 20 min, she stops to talk to a friend. She
talks for 10 min and then continues walking at the same pace. Fifteen minutes later, she stops for 5
min to rest. She starts walking at the same pace again and after 15 min, she decides to jog the rest
of the way home.” Describe any errors in the student’s graph. Sketch the correct
graph. 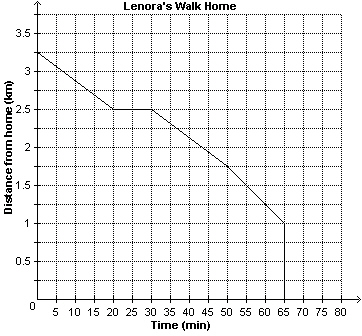 
|
|
|
19.
|
The graph represents the cost of printing pamphlets. 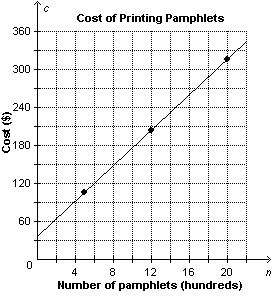 a)
Identify the dependent and independent variables. b)
Sohan calculated the rate of change as follows: Change in cost:  Change in number of pamphlets: 2000 pamphlets – 500 pamphlets = 1500
pamphlets Rate of change: 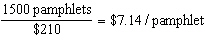 Did he calculate the rate of change correctly?
Explain. c) Describe what the rate of change
represents.
|