Multiple Choice
Identify the
choice that best completes the statement or answers the question.
|
|
|
1.
|
Which function is represented by the following graph? 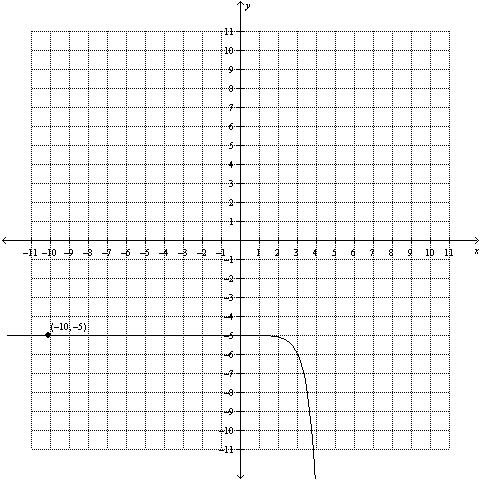
|
|
|
2.
|
What is the exponential equation for the function that results from the
transformations listed being applied to the base function  ? •
a reflection in the y-axis
• a vertical stretch by a factor of 6
• a
horizontal stretch by a factor of 7
|
|
|
3.
|
Which equation can be used to model the given information, where the population
has been rounded to the nearest whole number? Year (x) | Population
(y) | 0 | 100 | 1 | 104 | 2 | 108 | 3 | 112 | 4 | 117 | 5 | 122 | | |
|
|
|
4.
|
Solve for x.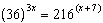
|
|
|
5.
|
A colony of ants has an initial population of 750 and triples every day. Which
function can be used to model the ant population, p, after t days?
|
|
|
6.
|
Jennifer deposited some money into an account that pays 7% per year, compounded
annually. Today her balance is $300. How much was in the account 10 years ago, to the nearest
cent? [Hint: Use  .] A | $163.18 | C | $42.86 | B | $30.00 | D | $152.50 |
|
|
|
7.
|
The population of a bacterial culture triples every hour. When the scientist
observed the culture, it had already been growing for some time. She developed the equation for the
population, P, after t hours as  , based on t = 0 representing the
time she started her measurements. How many bacterial cells were there 2 h before she started
measuring?
|
|
|
8.
|
Another way of writing  is
|
|
|
9.
|
The range of the function 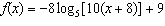 is
|
|
|
10.
|
Compared to the graph of the base function  , the graph of the function
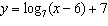 is translated A | 6 units to the right and 7 units up | C | 7 units to the right and 6 units
up | B | 7 units to the left and 6 units down | D | 6 units to the left and 7 units
down |
|
|
|
11.
|
Compared to the graph of the base function  , the graph of the
function  is A | translated down 10 units and left 6 units, horizontally stretched by a factor of  ,
reflected in the y-axis, vertically stretched by a factor of 3, and reflected in the
x-axis ,
reflected in the y-axis, vertically stretched by a factor of 3, and reflected in the
x-axis | C | translated down 10 units and left 6 units, horizontally stretched by a factor of  ,
not reflected in the y-axis, vertically stretched by a factor of 3, and not reflected in the
x-axis ,
not reflected in the y-axis, vertically stretched by a factor of 3, and not reflected in the
x-axis | B | translated down 10 units and right 6 units, horizontally stretched by a factor of
 , reflected in the y-axis, vertically stretched by a factor of 3, and not reflected in the
x-axis , reflected in the y-axis, vertically stretched by a factor of 3, and not reflected in the
x-axis | D | translated up 10
units and left 6 units, horizontally stretched by a factor of  , not reflected in the
y-axis, vertically stretched by a factor of 3, and not reflected in the
x-axis , not reflected in the
y-axis, vertically stretched by a factor of 3, and not reflected in the
x-axis |
|
|
|
12.
|
Which function represents a vertical translation of 7 units down, a horizontal
translation of 8 units right, a horizontal stretch by a factor of  , no reflection in the
y-axis, a vertical stretch by a factor of 6, and no reflection in the x-axis, when compared to the
base function  .
|
|
|
13.
|
Which graph represents the function  ?
|
|
|
14.
|
Which of the following is equivalent to the expression  ?
|
|
|
15.
|
The pH scale is used to measure the acidity or alkalinity of a solution. pH is
defined as  , where  is the concentration of hydronium ions, measured in moles
per litre. Determine the pH of a solution with a concentration of  . Round your answer to two
decimal places.
|
Short Answer
|
|
|
1.
|
Sketch the graph of an exponential function with all of the following
characteristics: • domain  • • range  •
y •
y-intercept of 3 • no x-intercept • the function is
always decreasing
|
|
|
2.
|
Solve for x: 
|
|
|
3.
|
Graphically solve the system  . 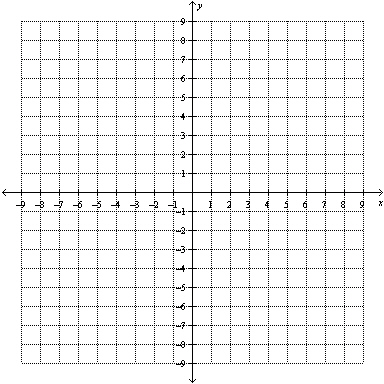
|
|
|
4.
|
Solve the equation  . Leave your answer in exact form.
|
|
|
5.
|
Solve for x. 
|
Problem
|
|
|
1.
|
a) Rewrite the function  in the form  . b) Describe the
transformations that must be applied to the graph of  to obtain the graph of the given
function. c) Graph the function. d) Determine the equation of the function that
results after the graph in part c) is reflected in the x-axis. e) Graph the function
from part d).
|
|
|
2.
|
A $21 500 investment earns 5.25% interest, compounded quarterly.
a)
Determine the value of the investment in 5 years.
b) How long will it take the original
investment to double in value?
|
|
|
3.
|
Sketch a graph of the function  and its inverse  . Compare the
graph of  to the graph of the function  . What conclusions can you make?
|