Multiple Choice
Identify the
choice that best completes the statement or answers the question.
|
|
|
1.
|
Which exponential equation matches the graph shown? 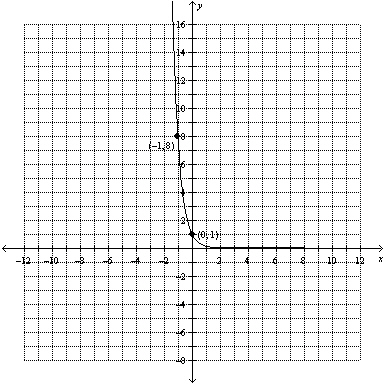
|
|
|
2.
|
The equation  can also be written as
|
|
|
3.
|
For the exponential function  , which of the following statements is
not true? A | The graph of the function is increasing. | B | The graph of the
function is decreasing. | C | The domain is the set of real
numbers. | D | The range is the set of real numbers greater than
zero. |
|
|
|
4.
|
Which function results when the graph of the function  is reflected
in the y-axis, compressed vertically by a factor of  , and shifted 2 units down?
|
|
|
5.
|
A radioactive sample with an initial mass of 1 mg has a half-life of 9 days.
What is the equation that models the exponential decay, A, for time, t, in 9-day
intervals?
|
|
|
6.
|
An investment of $150 is placed into an account that earns interest, compounded
annually, at a rate of 5% for 12 years. The amount, A, in the account can be modelled by the
function  , where t is the time, in years. What is the domain of this function?
|
|
|
7.
|
Solve for x. 
|
|
|
8.
|
Another way of writing  is
|
|
|
9.
|
Compared to the graph of the base function  , the graph of the
function  is A | translated down 10 units and left 6 units, horizontally stretched by a factor of  ,
reflected in the y-axis, vertically stretched by a factor of 3, and reflected in the
x-axis ,
reflected in the y-axis, vertically stretched by a factor of 3, and reflected in the
x-axis | C | translated down 10 units and left 6 units, horizontally stretched by a factor of  ,
not reflected in the y-axis, vertically stretched by a factor of 3, and not reflected in the
x-axis ,
not reflected in the y-axis, vertically stretched by a factor of 3, and not reflected in the
x-axis | B | translated down 10 units and right 6 units, horizontally stretched by a factor of
 , reflected in the y-axis, vertically stretched by a factor of 3, and not reflected in the
x-axis , reflected in the y-axis, vertically stretched by a factor of 3, and not reflected in the
x-axis | D | translated up 10
units and left 6 units, horizontally stretched by a factor of  , not reflected in the
y-axis, vertically stretched by a factor of 3, and not reflected in the
x-axis , not reflected in the
y-axis, vertically stretched by a factor of 3, and not reflected in the
x-axis |
|
|
|
10.
|
Which of the following is equivalent to the expression  ?
|
|
|
11.
|
If  ,  , and  , an algebraic expression
in terms of s, v, and z for  is A | v - 2s + 2z | C | v - 2(s - z) | B | v - 2(s + z) | D | v - 2s
+ z |
|
|
|
12.
|
Which if the following is equivalent to the expression  ?
|
|
|
13.
|
Evaluate the expression  to the nearest hundredth.
|
|
|
14.
|
A graduate student determines that the relationship between the length,
s, in metres, of the skull and the body mass, m, in kilograms, of a particular species
can be expressed using the equation  . Determine the body mass of an animal with a skull size of
0.56 m. Round your answer to the nearest kilogram. A | 547 kg | C | 343 kg | B | 376 kg | D | 313 kg |
|
|
|
15.
|
Solve  to the nearest hundredth.
|
Short Answer
|
|
|
1.
|
For the function  , a) describe the transformations of the function
when compared to the function  b) b) sketch the graph of the given function and
 on the same set of axes c) state the domain, the range, and the equation of the
asymptote
|
|
|
2.
|
Michael has invested some money with a financial institution. The scatter plot
shows how his money has grown over time. 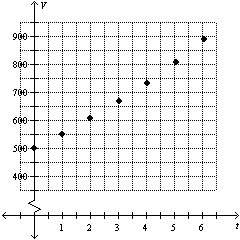 a) a) Do the data show an
exponential trend? Explain your reasoning. b) Estimate values of a and b to
develop a model for the information of the form  , for t in years. c) Use
your model to predict the expected value of Michael’s investment in 30 years. d) How
does the result in part c) illustrate the power of exponential growth?
|
|
|
3.
|
Graphically solve the system 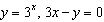 . 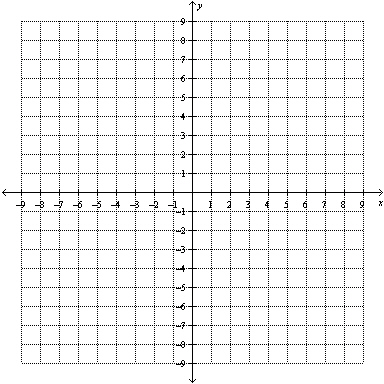
|
|
|
4.
|
Evaluate  .
|
|
|
5.
|
Solve the equation  . Leave your answer in exact form.
|
Problem
|
|
|
1.
|
A colony of ants starts with an initial population of 50 and doubles every week
for 8 weeks.
a) Create a table of values for weeks 0 to 8 for the population of the
colony.
b) Graph the data from your table of values.
c) Is the relationship
between the ant population and the number of weeks exponential? Explain.
d) Model the
information using an equation.
|
|
|
2.
|
a) Write the equation for a transformed exponential function whose
horizontal asymptote is y = 2, with a y-intercept of 4.
b) Is this function
unique? Explain.
c) Illustrate your answer to part b) graphically, using examples where
appropriate.
|
|
|
3.
|
An investment offers a bonus of 2% of the principal after being invested for 5
years. If $50 000 is invested at 4.75%, compounded annually, for 10 years, describe how the graph of
the investment with the bonus differs from the graph of the investment without the bonus.
|