Multiple Choice
Identify the
choice that best completes the statement or answers the question.
|
|
|
1.
|
Which set of properties is correct for the function  ?
|
|
|
2.
|
The equation  can also be written as
|
|
|
3.
|
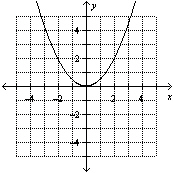
Which function is represented by the following graph? 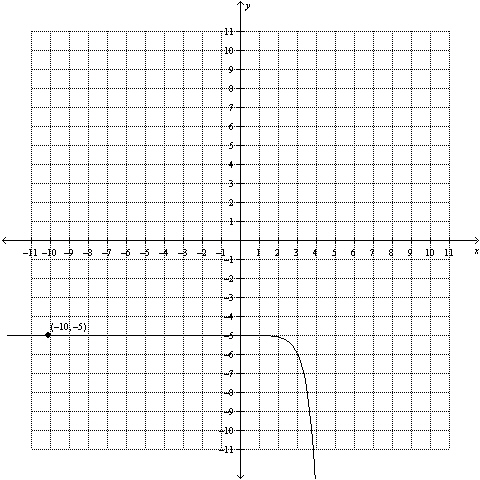
|
|
|
4.
|
Which equation can be used to model the given information, where the population
has been rounded to the nearest whole number? Year (x) | Population
(y) | 0 | 100 | 1 | 104 | 2 | 108 | 3 | 112 | 4 | 117 | 5 | 122 | | |
|
|
|
5.
|
A radioactive sample with an initial mass of 1 mg has a half-life of 15 days.
What is the equation that models the exponential decay, A, for time, t, in 15-day
intervals?
|
|
|
6.
|
A rumour is being spread in a community that the mayor is going to retire before
the next election. Initially, 5 people were told the rumour and each of these people told 5 others
the following day. Each of the 5 people told by the initial people told 5 others the day after they
were told. If this process keeps up, how many people will be told the rumour on the seventh
day?
A | 15 625 people | C | 35 people | B | 78 125 people | D | 390 625 people |
|
|
|
7.
|
Jennifer deposited some money into an account that pays 3% per year, compounded
annually. Today her balance is $300. How much was in the account 5 years ago, to the nearest
cent? [Hint: Use  .] A | $266.55 | C | $258.78 | B | $60.00 | D | $100.00 |
|
|
|
8.
|
Mohamed purchased a car for $34 000. It depreciates by 10% of its current value
every year. How much will the car be worth 3 years after it is purchased?
A | $45 254.00 | C | $24 786.00 | B | $11 333.33 | D | $340 000 |
|
|
|
9.
|
Another way of writing  is
|
|
|
10.
|
Compared to the graph of the base function  , the graph of the
function  is translated A | 2 units to the right | C | 2 units to the left | B | 2 units up | D | 2 units down |
|
|
|
11.
|
Which graph represents the function 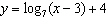 ?
|
|
|
12.
|
Which of the following is equivalent to the expression 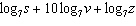 ?
|
|
|
13.
|
Evaluate the expression 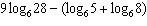 to the nearest hundredth.
|
|
|
14.
|
Solve  . Round your answer to two decimal places.
|
|
|
15.
|
Solve  . Round your answer to two decimal places.
|
Short Answer
|
|
|
1.
|
a) Determine the type of function shown in each graph. i)
 ii) ii) 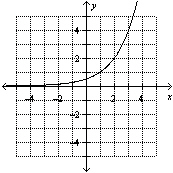 iii) iii) 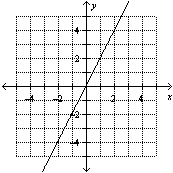 b) b) Describe what
you would expect to see in the first differences column of a table of values for each graph in part
a).
|
|
|
2.
|
Michael has invested some money with a financial institution. The scatter plot
shows how his money has grown over time. 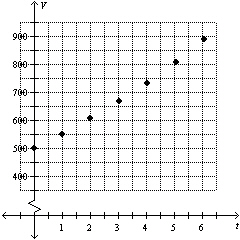 a) a) Do the data show an
exponential trend? Explain your reasoning. b) Estimate values of a and b to
develop a model for the information of the form  , for t in years. c) Use
your model to predict the expected value of Michael’s investment in 30 years. d) How
does the result in part c) illustrate the power of exponential growth?
|
|
|
3.
|
Solve for x: 
|
|
|
4.
|
Evaluate 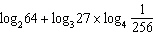 .
|
|
|
5.
|
Sketch the graph of the function 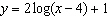 .
|
Problem
|
|
|
1.
|
Given  and  , find the value of  .
|
|
|
2.
|
Sketch a graph of the function  and its inverse  . Compare the
graph of  to the graph of the function 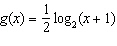 . What conclusions can you make?
|
|
|
3.
|
Explain the steps used to solve the equation 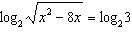 .
|