Multiple Choice
Identify the
choice that best completes the statement or answers the question.
|
|
|
1.
|
Which function, where x is in radians, is represented by the graph shown
below? 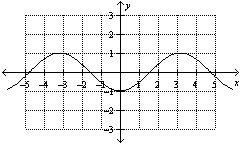
|
|
|
2.
|
The period (in degrees) of the graph of  is
|
|
|
3.
|
Which function is represented by the graph shown below, where x is in
degrees? A. | y = sin( x) x) | C. | y = cos( x) x) | B. | y = cos(x)
 | D. | y
= sin(x) sin(x) |
|
|
|
4.
|
What is the period of the sinusoidal function  ?
|
|
|
5.
|
Which graph represents the sinusoidal function  ?
|
|
|
6.
|
Which function represents the graph shown, where x is in radians? 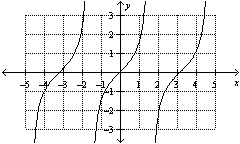
|
|
|
7.
|
Given the trigonometric function  , which is the x-coordinate at
which the function is undefined?
|
|
|
8.
|
Given the trigonometric function  , find the value of the
y-coordinate of the point with x-coordinate –1200°.
|
|
|
9.
|
What are the solutions for   = 0 in the interval  ? A. | x = 90° and 270°  | C. | x = 60° and 240° and 45° | B. |     | D. | x =
30° and 210°  |
|
|
|
10.
|
Solve  to three decimal places on the interval  . A. | x = 0.340, x = 5.943 | C. | x = 1.911, x =
1.231 | B. | x = 1.231, x = 5.052 | D. | x = 1.911, x =
4.373 |
|
Short Answer
|
|
|
1.
|
Explain how you could graph the function  given a table of values
containing ordered pairs for the function  .
|
|
|
2.
|
Sketch the graph of  for two cycles and state the domain, range, period, and
equations of the asymptotes. x is measured in radians.
|
Problem
|
|
|
1.
|
The table shows the hours of daylight measured on the first day of each month,
over a 1-year period in a northern Ontario city. Month | Hours of Daylight (h:min) | 1 | 8:25 | 2 | 9:55 | 3 | 11:35 | 4 | 13:30 | 5 | 15:48 | 6 | 16:15 | 7 | 15:25 | 8 | 14:26 | 9 | 12:35 | 10 | 10:39 | 11 | 9:01 | 12 | 8:00 | | |
a) Graph the table data. b) Use
the graph and the table to develop a sinusoidal model to represent the information. c)
Graph the model on the same set of axes as the data. Comment on the fit. d) Use your model
to estimate the number of hours of daylight, to the nearest tenth of an hour, on January 15, and
verify the solution using the graph.
|
|
|
2.
|
The graph of  is transformed so that the amplitude becomes 2 and the
x-intercepts coincide with the maximum values. a) What is the equation of the
transformed function? b) What phase shift of the transformed function will produce a
y-intercept of –1? c) What is the equation of the function after the
transformation in part b)? d) Verify your solution to part c) by graphing.
|
|
|
3.
|
a) Describe the transformations that must be applied to the graph of  to
obtain the graph of  . Be sure to list the transformations in the proper
order. b) State the domain and range of f( x) and
g( x). c) Modify the equation for g( x) to include a phase shift
of 90° to the right. Name this equation h( x).
|