Multiple Choice
Identify the
choice that best completes the statement or answers the question.
|
|
|
1.
|
Which function, where x is in radians, is represented by the graph shown
below? 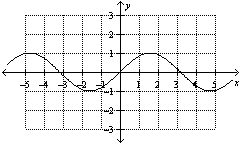
|
|
|
2.
|
The range (in radians) of the graph of  is
|
|
|
3.
|
The amplitude and period (in degrees) of  are A. | amplitude = –5
period =  | C. | amplitude = 
period =
 | B. | amplitude = 
period =  | D. | amplitude = 5
period =  |
|
|
|
4.
|
Which graph represents the function y =  cos(  x x),
where x is in degrees?
|
|
|
5.
|
What is the amplitude of the sinusoidal function  ? A. | 8 | C. | –7 | B. |  | D. | –2 |
|
|
|
6.
|
What is the period of the sinusoidal function  ?
|
|
|
7.
|
Which graph represents the sinusoidal function  ?
|
|
|
8.
|
What are the solutions for   = 0 in the interval  ? A. |     | C. | x = 30° and 210° and 54.7° | B. | x = 45°
and 225°  | D. | x = 60° and 240°  |
|
|
|
Use the following information to answer the questions.The height,
h, in centimetres, of a piston moving up and down in an engine cylinder can be modelled by the
function 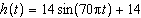 , where t is the time, in seconds.
|
|
|
9.
|
What is the period?
|
|
|
10.
|
Solve  , to the nearest tenth of a degree, if necessary, on the
interval  . A. | x = 120°, x = 60° | C. | x = 30°, x = 330° | B. | x = 60°,
x = 300° | D. | x = 120°, x = 240° |
|
Short Answer
|
|
|
1.
|
Explain how you could graph the function  given a table of values
containing ordered pairs for the function  .
|
|
|
2.
|
Sketch the graph of  for two cycles and state the domain, range, period, and
equations of the asymptotes. x is measured in radians.
|
Problem
|
|
|
1.
|
When a pendulum that is 0.5 m long swings back and forth, its angular
displacement, q, in radians, from rest position is given by  ,
where t is the time, in seconds. At what time(s) during the first 4 s is the pendulum
displaced 1 cm vertically above its rest position? (Assume the pendulum is at its rest position at
t = 0.)
|
|
|
2.
|
Sketch the graph of  for  .
|
|
|
3.
|
The table shows the hours of daylight measured on the first day of each month,
over a 1-year period in a northern Ontario city. Month | Hours of Daylight (h:min) | 1 | 8:25 | 2 | 9:55 | 3 | 11:35 | 4 | 13:30 | 5 | 15:48 | 6 | 16:15 | 7 | 15:25 | 8 | 14:26 | 9 | 12:35 | 10 | 10:39 | 11 | 9:01 | 12 | 8:00 | | |
a) Graph the table data. b) Use
the graph and the table to develop a sinusoidal model to represent the information. c)
Graph the model on the same set of axes as the data. Comment on the fit. d) Use your model
to estimate the number of hours of daylight, to the nearest tenth of an hour, on January 15, and
verify the solution using the graph.
|