Multiple Choice
Identify the
choice that best completes the statement or answers the question.
|
|
|
1.
|
The exact radian measure for an angle of 135° is
|
|
|
2.
|
John cuts a slice from a circular ice cream cake with a diameter of 28 cm. His
slice is in the shape of a sector with an arc length of 8 cm. What is the measure of the central
angle of the slice, in radians? Round your answer to two decimal places, if necessary.
A. | 3.50 rad | C. | 1.75 rad | B. | 0.57 rad | D. | 0.29 rad |
|
|
|
3.
|
The coordinates of the point that lies at the intersection of the terminal arm
and the unit circle at an angle of 228° are
A. | (–0.67, 1.11) | C. | (1.11, –0.74) | B. | (–0.67, –0.74) | D. | (–0.74,
–0.67) |
|
|
|
4.
|
If the angle q is –300° in standard
position, it can be described as having made
A. |  rotations rotations | C. |  rotations
 | B. |  rotations rotations | D. |  rotations rotations |
|
|
|
5.
|
A tricycle has a front wheel that is 33 cm in diameter and two rear wheels that
are each 15 cm in diameter. If the front wheel rotates through a angle of 130°, through how many
degrees does each rear wheel rotate, to the nearest tenth of a degree?
A. | 286.0Á | C. | 143.0Á | B. | 572.0Á | D. | 130.0° |
|
|
|
6.
|
The point P(0.951, 0.309) is the point of intersection of a unit circle and the
terminal arm of an angle q in standard position. What is the equation of
the line passing through the centre of the circle and the point P? Round the slope to two decimal
places.
|
|
|
7.
|
Which function, where x is in radians, is represented by the graph shown
below? 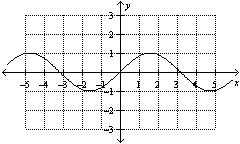
|
|
|
8.
|
The period (in degrees) of the graph of  is
|
|
|
9.
|
The amplitude and period (in degrees) of  are A. | amplitude = –2
period =  | C. | amplitude = 
period =
 | B. | amplitude = 
period =  | D. | amplitude = 2
period =  |
|
|
|
10.
|
Which function is represented by the graph shown below, where x is in
degrees?
|
|
|
11.
|
What is the amplitude of the sinusoidal function  ? A. | 5 | C. | 3 | B. | 2 | D. |  |
|
|
|
12.
|
Which function represents the graph shown, where x is in radians? 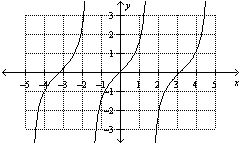
|
|
|
13.
|
Given the trigonometric function  , which is the x-coordinate at
which the function is undefined?
|
|
|
14.
|
What are the solutions for   = 0 in the interval  ? A. | x = 30° and 210°  | C. | x = 60° and 240° and 45° | B. |     | D. | x =
90° and 270°  |
|
|
|
15.
|
Solve  , to the nearest tenth of a degree, if necessary, on the
interval  . A. | x = 33.6°, x = 146.4° | C. | x = 146.4°, x =
213.6° | B. | x = 33.6°, x = 326.4° | D. | x = 56.4°, x = 303.6° |
|
Short Answer
|
|
|
1.
|
A grandfather clock shows a time of 7 o’clock. What is the exact radian
measure of the angle between the hour hand and the minute hand?
|
|
|
2.
|
Explain how you could graph the function  given a table of values
containing ordered pairs for the function  .
|
|
|
3.
|
Describe the transformations that, when applied to the graph of y = cos
x, result in the graph of  .
|
|
|
4.
|
A pebble is embedded in the tread of a rotating bicycle wheel of diameter 60 cm.
If the wheel rotates at 4 revolutions per second, determine a relationship between the height,
h, in centimetres, of the pebble above the ground as a function of time, t, in
seconds.
|
|
|
5.
|
A girl jumps rope such that the height, h, in metres, of the middle of
the rope can be approximated by the equation 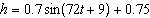 , where t is the time, in
seconds. a) What is the amplitude of this function? b) How many revolutions of
the rope does the girl make in 1 min?
|
Problem
|
|
|
1.
|
Sarah and Simone are walking in a walk-a-thon down a straight street that leads
to the finish line in the park. At the same time, they both notice a hot-air balloon directly over
the finish line. Sarah sees the angle from the ground to the balloon as 30° and Simone, who is
0.25 km closer to the finish line than Sarah, sees the angle from the ground to the balloon as
45°.
a) Draw a diagram to represent this situation.
b) If x
represents the distance that Simone is from the finish line, write an expression for the distance
from Sarah to the finish line.
c) Write a trigonometric ratio for each girl’s
position that involves the height of the balloon, h; the distance, x, each girl is away
from the finish line; and the angle from the girl to the balloon.
d) Rearrange each
equation from part c) to isolate h.
e) Set the two expressions for h equal to
each other and solve for x, to the nearest hundredth of a kilometre.
f) Determine
the height of the balloon, to the nearest hundredth of a kilometre.
|
|
|
2.
|
The point (–5, 7) is located on the terminal arm of ÐA in standard position.
a) Determine the primary trigonometric
ratios for ÐA.
b) Determine the primary trigonometric
ratios for ÐB with the same sine as ÐA, but different signs for the other two primary trigonometric
ratios.
c) Use a calculator to determine the measures of ÐA
and ÐB, to the nearest degree.
|
|
|
3.
|
A windmill has blades that are 20 m in length, and the centre of their circular
motion is a point 23 m above the ground. The blades have a frequency of 4 revolutions per minute when
in operation.
a) Use a sinusoidal function to model the height above the ground of the tip
of one blade as a function of time.
b) Graph the function over three complete
cycles.
c) How far above the ground is the tip of the blade after 10 s?
|
|
|
4.
|
The table shows the hours of daylight measured on the first day of each month,
over a 1-year period in a northern Ontario city. Month | Hours of Daylight (h:min) | 1 | 8:25 | 2 | 9:55 | 3 | 11:35 | 4 | 13:30 | 5 | 15:48 | 6 | 16:15 | 7 | 15:25 | 8 | 14:26 | 9 | 12:35 | 10 | 10:39 | 11 | 9:01 | 12 | 8:00 | | |
a) Graph the table data. b) Use
the graph and the table to develop a sinusoidal model to represent the information. c)
Graph the model on the same set of axes as the data. Comment on the fit. d) Use your model
to estimate the number of hours of daylight, to the nearest tenth of an hour, on January 15, and
verify the solution using the graph.
|
|
|
5.
|
Consider the graph of  . a) Describe the
transformations from the function  . b) Graph the two functions on the same set of
axes over the interval  . c) Given that  , explain where the
function 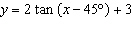 has vertical asymptotes.
|