Multiple Choice
Identify the
choice that best completes the statement or answers the question.
|
|
|
1.
|
Write the following fractions in ascending order:  ,
 ,  ,  ,  a. |  , ,  , ,  , ,  , ,  | c. |  , ,  , ,  , ,  , ,  | b. |  , ,  , ,  , ,
 , ,  | d. |  , ,  , ,  , ,
 , ,  |
|
|
|
2.
|
Which point on the number line represents the rational number  ? 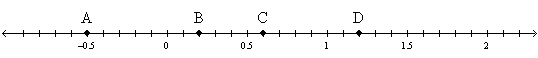
|
|
|
3.
|
Evaluate 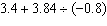
|
|
|
4.
|
The waiters at a restaurant give 30% of their tips to the kitchen staff at the
end of each shift. If a waiter collects $90.50 in tips, how much does he take home at the end of his
shift?
a. | $117.65 | c. | $27.15 | b. | $60.50 | d. | $63.35 |
|
|
|
5.
|
Determine the value of  .
|
|
|
6.
|
Emily has 8 large bags of popcorn to be divided among some smaller bags. The
smaller bags are  of the size of the large bags. How many smaller bags of
popcorn can Emily make?
|
|
|
7.
|
Calculate  .
|
|
|
8.
|
A square frame is projected onto a screen using an overhead projector. The
original square frame has a side length of 8.5 cm. The square frame is enlarged by a scale factor of
6.4. Determine the side length of the square frame on the screen.
a. | 14.9 cm | c. | 54.4 cm | b. | 217.6 cm | d. | 108.8 cm |
|
|
|
9.
|
Canada’s official measurement system is the __________.
a. | Avoirdupois system | c. | SI system | b. | US system | d. | imperial system |
|
|
|
10.
|
Triangles A and B are similar isosceles right triangles, related by a scale of
2:1. The two legs of Triangle A are 71.0 mm long. What is the approximate length of the hypotenuse of
Triangle B?  a. | 200.8 mm | c. | 142.0 mm | b. | 100.4 mm | d. | 71.0 mm |
|
|
|
11.
|
Triangles A and B are similar isosceles right triangles, related by a scale of
2:1. If the hypotenuse of Triangle B is 49 cm, what is the approximate length of one of the sides of
Triangle A? 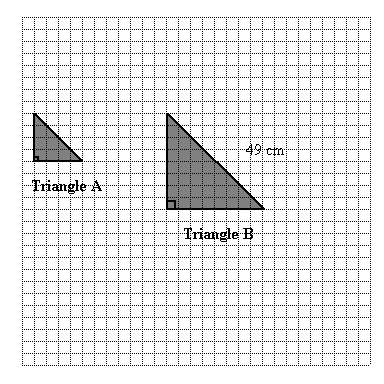 a. | 69.3 cm | c. | 49 cm | b. | 17.3 cm | d. | 69.0 cm |
|
|
|
12.
|
A farmer sketched the following layout of a field. He wants to develop a scale
drawing of the field in which 1 cm on the diagram represents 5 m of actual distance. The pipeline
runs across the diagonal of the field. Approximately how long will the line that represents the
pipeline be in the scale diagram?  a. | 500.0 cm | c. | 14.1 cm | b. | 10.0 cm | d. | 5.0 cm |
|
|
|
13.
|
What scale must be applied to make equilateral triangle JKL from equilateral
triangle RST? 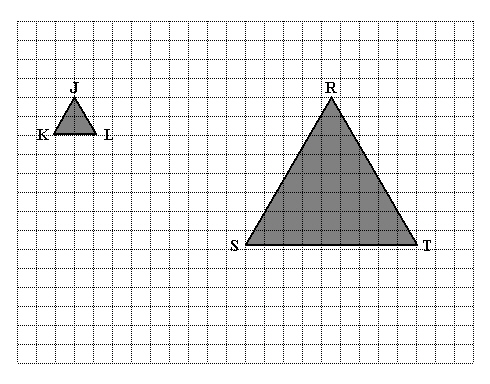
|
|
|
14.
|
Determine the scale factor used to draw Figure A from Figure B. 
|
|
|
15.
|
Write the number of unit squares in this large square as a power.  a. | 72 | c. | 77 | b. |  | d. |  |
|
|
|
16.
|
Evaluate the power  . a. | –1.2 | c. | 0.064 | b. | –0.064 | d. | 1.2 |
|
|
|
17.
|
The population of wolves in a certain area is 3250. If the growth of the wolf
population is 1.9% per year, what will be the population in 15 years?
|
|
|
18.
|
If  , then what is the value of  ?
|
|
|
19.
|
Evaluate  . a. | 15 625 | c. | 1 000 000 | b. | 244 140 625 | d. | 31 250 |
|
|
|
20.
|
Evaluate  .
|
|
|
21.
|
Evaluate: 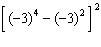 . a. | 8100 | c. | –8100 | b. | –5184 | d. | 5184 |
|
|
|
22.
|
In the term  , the letter d is best described as being a(n)
__________. a. | polynomial | c. | variable | b. | exponent | d. | coefficient |
|
|
|
23.
|
What is the opposite of the polynomial 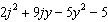 ?
|
|
|
24.
|
|
|
|
25.
|
What multiplication statement is represented by the algebra tiles below? 
|
|
|
26.
|
Expand  using the distributive property.
|
|
|
27.
|
Expand the expression  using the distributive property.
|
|
|
28.
|
The distance, in metres, travelled by a train, t seconds after the brakes
are applied, is given by the expression  . What is the expanded form of this expression?
|
|
|
Use the graphs to answer the following question(s).
|
|
|
29.
|
At what time has John walked 4 m further than Bill?
|
|
|
30.
|
The cost to print stickers is $6.95 plus $0.75 per sticker. Determine an
equation that relates the total cost, C, in dollars, to the number of stickers,
s.
|
|
|
Use the figures to answer the following question(s).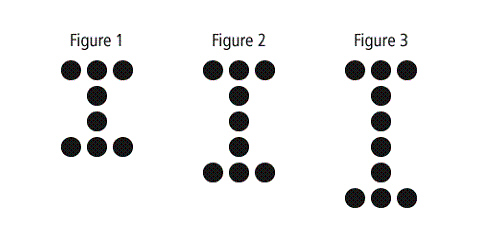
|
|
|
31.
|
How many dots would the next figure contain?
|
|
|
32.
|
Following the pattern, which figure number will have 42 dots?
|
|
|
33.
|
Following the pattern above, how many dots will Figure 5 contain?
|
|
|
34.
|
How many dots would the next figure contain?
|
|
|
Each line segment is 7 units long. Use the figures to answer the following
question(s).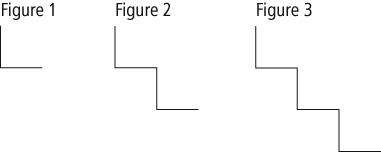
|
|
|
35.
|
Describe the pattern in the relationship between the figure number and the
figure length.
a. | The length of the figure is 14 times the figure number. | c. | The length of the
figure is 7 times the figure number. | b. | The length of the figure is 12 more than the
figure number. | d. | The length
of the figure is 6 more than the figure number. |
|
|
|
36.
|
Solve 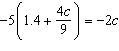 .
|
|
|
37.
|
Solve  .
|
|
|
38.
|
Solve  .
|
|
|
39.
|
Solve 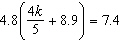 . a. | k = 13.05 | c. | k = 8.35 | b. | k = –9.2 | d. | k =
14.38 |
|
|
|
40.
|
Solve for x in  . a. | x = 10 | c. | x = 1.5 | b. | x = 5 | d. | x = 0.75 |
|
|
|
41.
|
Solve the following: 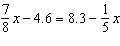 . a. | x = 12 | c. | x = 19.1 | b. | x = 3.4 | d. | x = 5.5 |
|
|
|
42.
|
Solve  . a. | x = –30 | c. | x = 2 | b. | x = 46 | d. | x =
–2 |
|
|
|
43.
|
Marc had 6 coupons for $2.00 off the regular admission price of a movie. He
bought tickets for himself and 5 friends. He paid $51.00. What was the regular price for each
ticket?
a. | $10.50 | c. | $17.00 | b. | $12.00 | d. | $19.00 |
|
|
|
44.
|
During a team meeting, a hockey coach asks each person, “Who is our
weakest player?” This is an example of
a. | bias | c. | lack of privacy | b. | cultural insensitivity | d. | inappropriate
ethics |
|
|
|
45.
|
In which situation might the cost of the study outweigh the benefits?
a. | A teacher asks her class to complete a survey with the question, “What is your
favourite subject?” | c. | Every household in the city is mailed a survey asking, “Do
you think tulips should be planted in the city parks?” | b. | A butcher surveys
all of the customers in his shop to determine if they prefer hamburgers or hot
dogs. | d. | Students in a class
are asked, “Do you like your parents?” |
|
|
|
Use the information provided to answer the following
question(s).Ms. Jenkins gave her class a quiz worth 15 points. After marking the first 4
quizzes, she predicted that the class would not do well on the test. The quiz scores are shown
below. 6 | 6 | 9 | 8 | 12 | 12 | 13 | 15 | 9 | 11 | 11 | 12 | 8 | 15 | 9 | 10 | 14 | 12 | 15 | 11 | 7 | 9 | 4 | 6 | 9 | 12 | 12 | 14 | 10 | 11 | | | | | |
|
|
|
46.
|
What is the mean score for the entire class?
|
|
|
47.
|
What is the median score for the entire class?
|
|
|
48.
|
A coach is checking the statistics on a player and wants to know whether the
player is making progress over the season. Is the graph shown below the best graph to use?  a. | No, because you cannot easily compare the data between two games. | c. | Yes, because you
can see a positive trend in the data over time. | b. | Yes, because the data can be easily
counted. | d. | No, because you
cannot see the full season. |
|
|
|
|
|
|
49.
|
Which graph would be best for showing the number of each type of movie that was
chosen?
a. | circle graph | c. | bar graph | b. | line graph | d. | double bar
graph |
|
|
|
50.
|
The best graph for showing the fraction of horror movies people chose would be
a
a. | line graph, to show changes over time | c. | pictograph that shows different
movie posters for each type | b. | circle graph, to show the percent of horror
movies out of all the choices | d. | double bar graph, to compare two sets of data across
categories |
|