Multiple Choice
Identify the
choice that best completes the statement or answers the question.
|
|
|
1.
|
In which situation is there no influencing factor?
a. | After a baseball game, the people leaving the stadium are surveyed to determine their
favourite sport. | c. | Every household in the city is mailed a survey asking, “Do you think tulips
should be planted in the city parks?” | b. | A teacher asks her class to complete an
anonymous survey with the question, “What is your favourite subject?” | d. | A teacher asks her class to complete a survey
and print their names on the top of the survey. |
|
|
|
2.
|
Which of the following questions is free from influencing factors?
a. | Do you prefer chocolate or vanilla ice cream? | c. | If you use a computer at home, how
much time per week do you spend using it? | b. | Which of these four colours is your favourite:
red, blue, green, or yellow? | d. | How much money do you make at your part-time job? |
|
|
|
3.
|
A stratified sample is created by
a. | choosing respondents from the population who are easy to access | c. | dividing the
population into groups and then choosing the same percent of respondents from each
group | b. | inviting the whole population to participate | d. | choosing respondents from the population at
random |
|
|
|
4.
|
Which population would you use if you were asking: “Are Canadian voters
supportive of the Prime Minister?”
a. | a sample from the voting-age population of Canada | c. | the entire population of
Canada | b. | all adults between 21 and 65 years | d. | all the people who voted in the last federal
election |
|
|
|
|
|
|
5.
|
What makes this graph misleading?
a. | The representation of Indira’s calls is shorter than the others. | c. | The representation
of Samantha’s calls is taller than the others. | b. | The representation of users’ calls is not
a consistent width. | d. | The
representation of each user’s calls is a different height. |
|
|
|
6.
|
A random sample is created by
a. | inviting the whole population to participate | c. | dividing the population into groups
and then choosing the same percent of respondents from each group | b. | choosing respondents
from the population who are easy to access | d. | choosing respondents from the population at random |
|
|
|
7.
|
Students are surveyed to find out their favourite sport. What method of
selection will produce an unbiased sample?
a. | ask only the people who play sports | c. | ask every 5th person on the school
list | b. | ask only the boys | d. | ask the first 20 people who leave the basketball game |
|
|
|
Use the information provided to answer the following
question(s).Ms. Jenkins gave her class a quiz worth 15 points. After marking the first 4
quizzes, she predicted that the class would not do well on the test. The quiz scores are shown
below. 6 | 6 | 9 | 8 | 12 | 12 | 13 | 15 | 9 | 11 | 11 | 12 | 8 | 15 | 9 | 10 | 14 | 12 | 15 | 11 | 7 | 9 | 4 | 6 | 9 | 12 | 12 | 14 | 10 | 11 | | | | | |
|
|
|
8.
|
What statement best describes this situation?
a. | Ms. Jenkins’ conclusion is valid because the sample is representative of the
class. | c. | Ms. Jenkins is making a false prediction because the sample mean is not the same as
the mode. | b. | Ms. Jenkins is making a false prediction because the sample does not represent the
population. | d. | Ms.
Jenkins’ conclusion is valid because the sample is taken from the class
scores. |
|
|
|
|
|
|
9.
|
This line graph shows the number of baskets scored by Julie and Erica during six
games. A clearer way to show this comparison might be to use a
a. | double bar graph that records the number of baskets each player scored in each
game | c. | bar graph to show the total number of baskets scored in each game | b. | pictograph showing
the total number of baskets scored in each game | d. | circle graph showing the percent of baskets
each player scored during the season |
|
|
|
|
|
|
10.
|
Which of the two graphs would you use if you wanted to know the total number of
plants in the garden?
a. | The circle graph, because it is easy to add the percents. | c. | The circle graph,
because it tells you there are 100 plants. | b. | The pictograph, because you can see how many
carrot plants are in each picture. | d. | The pictograph, because the symbols are easy to
count. |
|
Short Answer
|
|
|
11.
|
As a group of music fans leave a concert, they are asked to identify their
favourite band.
a) What influencing factor will affect the survey responses?
Explain.
b) How could the bias be removed?.
|
|
|
12.
|
Identify the sampling technique used in each survey. Explain your
selection.
a) A television host asks for opinions by selecting and interviewing people in
front of the downtown studio.
b) A computer is programmed to randomly select 100 names from
a club’s membership list.
|
|
|
13.
|
For the following situation, identify whether there is bias. If so, identify the
bias. Then, rewrite the statement to correct it.
Ask horseback riders if they would support
building a public park on the site of their stable.
|
|
|
14.
|
A group of BC Lions fans are asked who they think will win the next Grey Cup.
a) Is this an appropriate sample? Explain.
b) What could be done to improve the
sample?
|
|
|
15.
|
A farmer wants to check his corn crop for signs of ear rot. Identify each of the
following sampling methods the farmer could use.
a) Assign a number to each stalk. Randomly
select a starting stalk number and then inspect every tenth stalk after it.
b) Sample 10%
of the stalks closest to the road.
c) Divide the crop into sections and randomly select 10%
of the stalks in each section.
|
Problem
|
|
|
16.
|
a) From the pictograph, which fruit seems to
sell the best? Explain.
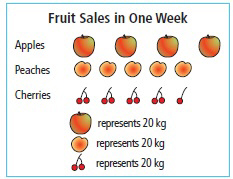
b) Does it seem that more cherries were sold or more
peaches? Explain.
c) How should the pictograph be redrawn to represent the data more
accurately?
|
|
|
17.
|
For each situation, identify and describe any factors that may influence the
collection of data.
a) A sales representative e-mails a survey to you. In exchange for your
participation, you will have a chance to win a trip for two people to a destination you choose. There
is no other information.
b) An interest group surveys community residents about whether or
not they would support a curfew for teens. The survey is being conducted the week after several
incidents of vandalism at the high school were reported in the newspaper.
c) A village
council wants to know if residents are in favour of building a new skating arena. The council decides
to survey 500 people at the next hockey game.
|