Multiple Choice
Identify the
choice that best completes the statement or answers the question.
|
|
|
1.
|
During a team meeting, a hockey coach asks each person, “Who is our
weakest player?” This is an example of
a. | bias | c. | lack of privacy | b. | cultural insensitivity | d. | inappropriate
ethics |
|
|
|
2.
|
A textile company would like to know how people feel about the new mill they are
about to open in a community. Which survey question is the most appropriate?
a. | Do you agree with the very narrow-minded few who are not in favour of the new
mill? | c. | Do you agree with everyone else that the new mill is a great
idea? | b. | Are you in favour of the new mill that will bring many jobs to the
area? | d. | Are you in favour of
having a textile mill in your community? |
|
|
|
3.
|
A sample of high school students is created by first dividing the whole student
body into age groups and then choosing the same fraction of members from each group. What type of
sampling method is used here?
a. | stratified | c. | convenience | b. | random | d. | systematic |
|
|
|
4.
|
Predictions based on a sample taken from a normally distributed population are
more accurate when
a. | the sample population is all the same age | c. | the sample size is
large | b. | the sample size is small | d. | the sample is taken from only one geographical part of the
area |
|
|
|
5.
|
Students are surveyed to find out their favourite sport. What method of
selection will produce an unbiased sample?
a. | ask only the people who play sports | c. | ask every 5th person on the school
list | b. | ask only the boys | d. | ask the first 20 people who leave the basketball game |
|
|
|
Use the information provided to answer the following
question(s).Ms. Jenkins gave her class a quiz worth 15 points. After marking the first 4
quizzes, she predicted that the class would not do well on the test. The quiz scores are shown
below. 6 | 6 | 9 | 8 | 12 | 12 | 13 | 15 | 9 | 11 | 11 | 12 | 8 | 15 | 9 | 10 | 14 | 12 | 15 | 11 | 7 | 9 | 4 | 6 | 9 | 12 | 12 | 14 | 10 | 11 | | | | | |
|
|
|
6.
|
If the sample is biased, what should Ms. Jenkins have done differently?
a. | She should have calculated the mean, median, and mode for the sample. | c. | She should have
used the scores from the first five students to finish the quiz. | b. | The sample is not
biased. | d. | She should have
randomly selected a larger sample of student quizzes to mark. |
|
|
|
7.
|
How could you alter this graph to make it misleading? 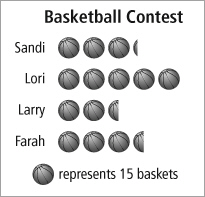 a. | Change the names of the participants. | c. | Put Larry’s data first,
followed by Sandi’s, then Farah’s, and then Lori’s. | b. | Use better pictures
of balls that are all the same size. | d. | Make Sandi’s balls bigger than Lori’s balls so that Sandi’s line is
longer. |
|
|
|
|
|
|
8.
|
One reason the pictograph is difficult to interpret is because
a. | there are too many images representing beans and carrots | c. | there are too many
images of carrots | b. | the images of the snow peas are too far
apart | d. | the images of the
broccoli are unclear |
|
|
|
|
|
|
9.
|
What makes this graph misleading?
a. | The representation of Indira’s calls is shorter than the others. | c. | The representation
of Samantha’s calls is taller than the others. | b. | The representation of users’ calls is not
a consistent width. | d. | The
representation of each user’s calls is a different height. |
|
|
|
|
|
|
10.
|
The best graph for showing the fraction of horror movies people chose would be
a
a. | line graph, to show changes over time | c. | pictograph that shows different
movie posters for each type | b. | circle graph, to show the percent of horror
movies out of all the choices | d. | double bar graph, to compare two sets of data across
categories |
|
Short Answer
|
|
|
11.
|
Robin is interested in identifying the most popular lunch specials in the school
cafeteria. She asks a random selection of students: “Why don’t you like the lunch
specials?” What influencing factor is present in this survey? Explain.
|
|
|
12.
|
As a group of music fans leave a concert, they are asked to identify their
favourite band.
a) What influencing factor will affect the survey responses?
Explain.
b) How could the bias be removed?.
|
|
|
13.
|
Write a survey question for the following situation. Identify who you would ask
to participate in the survey.
You want to find out if price or brand is
more important when buying a cell phone.
|
|
|
14.
|
Write a survey question for the following situation. Identify who you would ask
to participate in the survey.
You want to find out which media source
people trust most to give them accurate information.
|
|
|
15.
|
What is the difference between a sample and a population?
|
Problem
|
|
|
Write your answer in the space provided.
|
|
|
16.
|
A number of people at a public swimming pool are surveyed about raising local
taxes to help fund a public swimming pool.
a) Identify and explain the bias in this
sample.
b) Suggest how the bias could be removed.
|
|
|
17.
|
For each context, would you recommend surveying the population or a sample?
Justify your choice. a) You want to determine the air quality
in hospitals in Victoria, BC.
b) You want to know post-secondary plans of grade 9
students.
c) You want to test the quality of parachutes.
d) You want to test the
quality of bike tires.
|