Multiple Choice
Identify the
choice that best completes the statement or answers the question.
|
|
|
1.
|
A school principal surveys only the boys in one class to determine if she should
make recess longer. This is an example of
a. | inappropriate use of language | c. | cultural
insensitivity | b. | bias | d. | poor
timing |
|
|
|
2.
|
A group of students are surveyed to determine their favourite sport. They are
surveyed as they leave the gym after a basketball game. This is an example of
a. | bias | c. | inappropriate use of language | b. | poor timing | d. | cultural
insensitivity |
|
|
|
3.
|
A random sample is created by
a. | inviting the whole population to participate | c. | dividing the population into groups
and then choosing the same percent of respondents from each group | b. | choosing respondents
from the population who are easy to access | d. | choosing respondents from the population at random |
|
|
|
4.
|
A voluntary response sample is created by
a. | dividing the population into groups and then choosing the same percent of respondents
from each group | c. | inviting the whole population to participate if they wish | b. | choosing respondents
from the population who are easy to access | d. | choosing respondents from the population at random |
|
|
|
5.
|
Predictions based on a sample taken from a normally distributed population are
more accurate when
a. | the sample population is all the same age | c. | the sample size is
large | b. | the sample size is small | d. | the sample is taken from only one geographical part of the
area |
|
|
|
Use the information provided to answer the following
question(s).Ms. Jenkins gave her class a quiz worth 15 points. After marking the first 4
quizzes, she predicted that the class would not do well on the test. The quiz scores are shown
below. 6 | 6 | 9 | 8 | 12 | 12 | 13 | 15 | 9 | 11 | 11 | 12 | 8 | 15 | 9 | 10 | 14 | 12 | 15 | 11 | 7 | 9 | 4 | 6 | 9 | 12 | 12 | 14 | 10 | 11 | | | | | |
|
|
|
6.
|
What is the median score for the entire class?
|
|
|
7.
|
Linda and Matt each survey 20 people about the carving in front of the post
office. Linda was at the mall entrance and Matt was at the entrance to the fine arts centre. When
they compared their results, the responses were very different. What influencing factor(s) may have
caused the difference?
a. | timing | c. | all of the these | b. | cultural sensitivity | d. | wording |
|
|
|
8.
|
A coach is checking the statistics on a player and wants to know whether the
player is making progress over the season. Is the graph shown below the best graph to use?  a. | No, because you cannot easily compare the data between two games. | c. | Yes, because you
can see a positive trend in the data over time. | b. | Yes, because the data can be easily
counted. | d. | No, because you
cannot see the full season. |
|
|
|
|
|
|
9.
|
A movie producer wants to distort the graph to make it appear as though dramas
are more popular than they are. She could do this by
a. | changing the width of the drama bar so that is it twice as wide as the
others | c. | changing the order of the films so that drama is first | b. | changing the scale
on the side so that every number is marked | d. | changing the patterns on the bars so drama has the same pattern as
horror |
|
|
|
10.
|
Which graph would be best for showing what percent of the time each type of
movie was chosen?
a. | double bar graph | c. | circle graph | b. | bar graph | d. | line graph |
|
Short Answer
|
|
|
11.
|
For the following statement, identify whether there is bias. If so, identify the
bias. Then, rewrite the statement to correct it.
Ask all horse owners if they are willing
to pay higher horse-boarding fees.
|
|
|
12.
|
When interpreting the results of a political poll, why is it important to know
the source of the poll?
|
|
|
13.
|
You have been hired to develop Arctic adventure tours. Develop three survey
questions to help determine the activities that appeal to tourists.
|
|
|
14.
|
A farmer wants to check his corn crop for signs of ear rot. Identify each of the
following sampling methods the farmer could use.
a) Assign a number to each stalk. Randomly
select a starting stalk number and then inspect every tenth stalk after it.
b) Sample 10%
of the stalks closest to the road.
c) Divide the crop into sections and randomly select 10%
of the stalks in each section.
|
|
|
15.
|
What might cause the following graph to be misinterpreted? 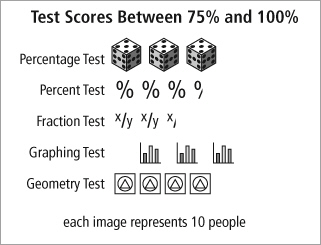
|
Problem
|
|
|
16.
|
a) From the pictograph, which fruit seems to
sell the best? Explain.
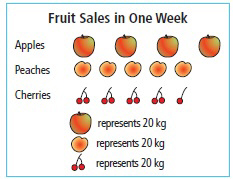
b) Does it seem that more cherries were sold or more
peaches? Explain.
c) How should the pictograph be redrawn to represent the data more
accurately?
|
|
|
17.
|
The graph in this advertisement shows the results of
a taste test.
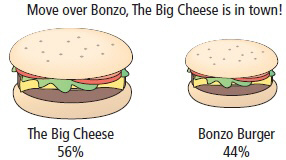
a) Which burger seems to be the favourite?
Explain.
b) How is the graph misleading?
c) How should the graph be redrawn to
represent the data more accurately?
|