Multiple Choice
Identify the
choice that best completes the statement or answers the question.
|
|
|
1.
|
A teacher offers her class ten extra minutes of recess if they complete a
survey. This is an example of
a. | poor timing | c. | bias | b. | inappropriate ethics | d. | cultural insensitivity
|
|
|
|
2.
|
In which situation might privacy be an influencing factor?
a. | Students in a class are asked to complete an anonymous survey with the question,
“Do you like your parents?” | c. | A teacher asks her class to
complete a survey and print their names on the top of the survey. | b. | Every household in
the city is mailed a survey asking, “Do you think it is important to maintain the city’s
parks?” | d. | After a
winter storm, a travel agency sends out a survey asking, “Would you like to take a holiday in
Mexico?” |
|
|
|
3.
|
A random sample is created by
a. | inviting the whole population to participate | c. | dividing the population into groups
and then choosing the same percent of respondents from each group | b. | choosing respondents
from the population who are easy to access | d. | choosing respondents from the population at random |
|
|
|
4.
|
A sample of high school students is created by first dividing the whole student
body into age groups and then choosing the same fraction of members from each group. What type of
sampling method is used here?
a. | stratified | c. | convenience | b. | random | d. | systematic |
|
|
|
Use the information provided to answer the following
question(s).Ms. Jenkins gave her class a quiz worth 15 points. After marking the first 4
quizzes, she predicted that the class would not do well on the test. The quiz scores are shown
below. 6 | 6 | 9 | 8 | 12 | 12 | 13 | 15 | 9 | 11 | 11 | 12 | 8 | 15 | 9 | 10 | 14 | 12 | 15 | 11 | 7 | 9 | 4 | 6 | 9 | 12 | 12 | 14 | 10 | 11 | | | | | |
|
|
|
5.
|
What statement best describes this situation?
a. | Ms. Jenkins’ conclusion is valid because the sample is representative of the
class. | c. | Ms. Jenkins is making a false prediction because the sample mean is not the same as
the mode. | b. | Ms. Jenkins is making a false prediction because the sample does not represent the
population. | d. | Ms.
Jenkins’ conclusion is valid because the sample is taken from the class
scores. |
|
|
|
6.
|
What is the median score for the entire class?
|
|
|
7.
|
Linda and Matt each survey 20 people about the carving in front of the post
office. Linda was at the mall entrance and Matt was at the entrance to the fine arts centre. When
they compared their results, the responses were very different. What influencing factor(s) may have
caused the difference?
a. | timing | c. | all of the these | b. | cultural sensitivity | d. | wording |
|
|
|
8.
|
How could you alter this graph to make it misleading? 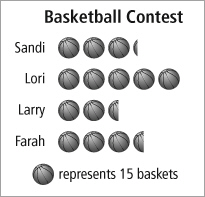 a. | Change the names of the participants. | c. | Put Larry’s data first,
followed by Sandi’s, then Farah’s, and then Lori’s. | b. | Use better pictures
of balls that are all the same size. | d. | Make Sandi’s balls bigger than Lori’s balls so that Sandi’s line is
longer. |
|
|
|
|
|
|
9.
|
Which of the two graphs would you use if you wanted to know the total number of
plants in the garden?
a. | The circle graph, because it is easy to add the percents. | c. | The circle graph,
because it tells you there are 100 plants. | b. | The pictograph, because you can see how many
carrot plants are in each picture. | d. | The pictograph, because the symbols are easy to
count. |
|
|
|
|
|
|
10.
|
Which graph would be best for showing what percent of the time each type of
movie was chosen?
a. | double bar graph | c. | circle graph | b. | bar graph | d. | line graph |
|
Short Answer
|
|
|
11.
|
For the following situation, identify whether there is bias. If so, identify the
bias. Then, rewrite the statement to correct it.
Ask horseback riders if they would support
building a public park on the site of their stable.
|
|
|
12.
|
Write two different survey questions that may have resulted in the following
conclusion:
Yellow is the most popular shirt colour.
|
|
|
13.
|
Write a survey question for the following situation. Identify who you would ask
to participate in the survey.
You want to find out which media source
people trust most to give them accurate information.
|
|
|
14.
|
When interpreting the results of a political poll, why is it important to know
the source of the poll?
|
|
|
Julie took a survey to see which topping was the most popular for
pizza. 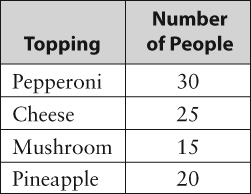
|
|
|
15.
|
Determine a way in which you could distort a graph to make it appear that more
people chose mushrooms.
|
Problem
|
|
|
16.
|
The graph in this advertisement shows the results of
a taste test.
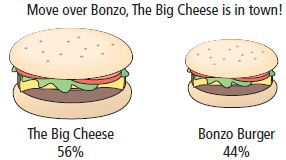
a) Which burger seems to be the favourite?
Explain.
b) How is the graph misleading?
c) How should the graph be redrawn to
represent the data more accurately?
|
|
|
17.
|
a) Explain how this graph is
misleading.
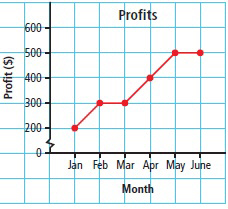
b) From the graph, what conclusion can you make
about the profits from January to June?
c) Draw a new graph using a vertical scale from 0
to 600. What conclusion can you now make about the profits from January to June?
|