Multiple Choice
Identify the
choice that best completes the statement or answers the question.
|
|
|
Choose the best answer.
|
|
|
1.
|
Sampling bias may result when
a. | the sample accurately represents the population | c. | participants are chosen at
random | b. | culturally sensitive questions are asked in the survey | d. | a large percent of people in the sample refuse
to answer the survey |
|
|
|
2.
|
In which situation is there no influencing factor?
a. | After a baseball game, the people leaving the stadium are surveyed to determine their
favourite sport. | c. | Every household in the city is mailed a survey asking, “Do you think tulips
should be planted in the city parks?” | b. | A teacher asks her class to complete an
anonymous survey with the question, “What is your favourite subject?” | d. | A teacher asks her class to complete a survey
and print their names on the top of the survey. |
|
|
|
3.
|
A random sample is created by
a. | inviting the whole population to participate | c. | dividing the population into groups
and then choosing the same percent of respondents from each group | b. | choosing respondents
from the population who are easy to access | d. | choosing respondents from the population at random |
|
|
|
4.
|
A concert promoter wants to give ten free concert tickets to a random sample of
people waiting outside the ticket office. He selects one wristband number and then every tenth number
after that. What is the sampling method being used here?
a. | systematic | c. | random | b. | convenience | d. | stratified |
|
|
|
5.
|
Students are surveyed to find out their favourite sport. What method of
selection will produce an unbiased sample?
a. | ask only the people who play sports | c. | ask every 5th person on the school
list | b. | ask only the boys | d. | ask the first 20 people who leave the basketball game |
|
|
|
Use the information provided to answer the following
question(s).Ms. Jenkins gave her class a quiz worth 15 points. After marking the first 4
quizzes, she predicted that the class would not do well on the test. The quiz scores are shown
below. 6 | 6 | 9 | 8 | 12 | 12 | 13 | 15 | 9 | 11 | 11 | 12 | 8 | 15 | 9 | 10 | 14 | 12 | 15 | 11 | 7 | 9 | 4 | 6 | 9 | 12 | 12 | 14 | 10 | 11 | | | | | |
|
|
|
6.
|
What statement best describes this situation?
a. | Ms. Jenkins’ conclusion is valid because the sample is representative of the
class. | c. | Ms. Jenkins is making a false prediction because the sample mean is not the same as
the mode. | b. | Ms. Jenkins is making a false prediction because the sample does not represent the
population. | d. | Ms.
Jenkins’ conclusion is valid because the sample is taken from the class
scores. |
|
|
|
7.
|
What is the mean score for the entire class?
|
|
|
|
|
|
8.
|
A movie producer wants to distort the graph to make it appear as though dramas
are more popular than they are. She could do this by
a. | changing the width of the drama bar so that is it twice as wide as the
others | c. | changing the order of the films so that drama is first | b. | changing the scale
on the side so that every number is marked | d. | changing the patterns on the bars so drama has the same pattern as
horror |
|
|
|
9.
|
Which graph would be best for showing what percent of the time each type of
movie was chosen?
a. | double bar graph | c. | circle graph | b. | bar graph | d. | line graph |
|
|
|
10.
|
The best graph for showing the fraction of horror movies people chose would be
a
a. | line graph, to show changes over time | c. | pictograph that shows different
movie posters for each type | b. | circle graph, to show the percent of horror
movies out of all the choices | d. | double bar graph, to compare two sets of data across
categories |
|
Short Answer
|
|
|
11.
|
As a group of music fans leave a concert, they are asked to identify their
favourite band.
a) What influencing factor will affect the survey responses?
Explain.
b) How could the bias be removed?.
|
|
|
12.
|
Write two different survey questions that may have resulted in the following
conclusion:
Most juice lovers prefer apple and orange juice.
|
|
|
13.
|
When interpreting the results of a political poll, why is it important to know
the source of the poll?
|
|
|
Julie took a survey to see which topping was the most popular for
pizza. 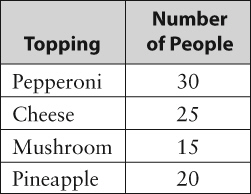
|
|
|
14.
|
Determine a way in which you could distort a graph to make it appear that more
people chose mushrooms.
|
|
|
15.
|
How might this graph mislead people? 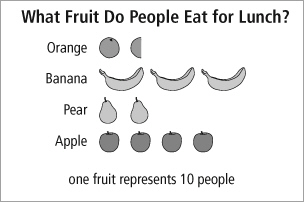
|
Problem
|
|
|
16.
|
Statsville High School has 240 students in grade 9, 220 in grade 10, 205 in
grade 11, and 190 in grade 12. The administration wants to know if students would prefer a semestered
timetable.
a) Describe the population.
b) Design a sampling procedure to sample
15% of the students.
c) Describe how you will collect the data.
d) Describe how
you will display the data.
e) Describe how you would analyze the data.
f)
Describe how you would present your findings and what would be included.
|
|
|
17.
|
The graph shows the progress of friends who are
playing a video game.
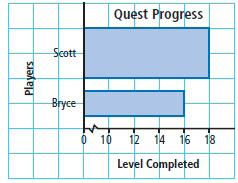
a) Explain how this graph could be
misleading.
b) What conclusion does the graph suggest about Scott’s progress compared
with Bryce’s progress?
c) Describe how to redraw the graph to represent the data more
accurately.
|