Multiple Choice
Identify the
choice that best completes the statement or answers the question.
|
|
|
Choose the best answer.
|
|
|
1.
|
Determine the scale factor for this scale diagram. 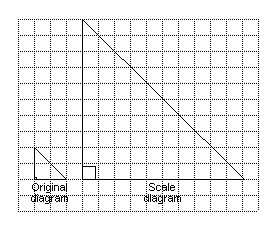 a. | 5 | c. | 25 | b. |  | d. | 10 |
|
|
|
2.
|
The scale diagram below shows a cross-section of a pipe. The scale of the
diagram is 1:4. What is the inside diameter of the actual pipe?  Diagram not drawn to scale Diagram not drawn to scalea. | 20 cm | c. | 6 cm | b. | 2.5 cm | d. | 24 cm |
|
|
|
3.
|
Determine the length of BD in this pair of similar triangles.  Diagram not drawn to
scale Diagram not drawn to
scalea. | 3 cm | c. | 3 cm | b. | 6.75 cm | d. | 4 cm |
|
|
|
4.
|
When the shadow of a flagpole is 36 m long, a 1.8-m fencepost casts a shadow
that is 3 m long. How tall is the flagpole?
a. | 12.6 m | c. | 21.6 m | b. | 60 m | d. | 20.9 m |
|
|
|
5.
|
Canada’s official measurement system is the __________.
a. | Avoirdupois system | c. | SI system | b. | US system | d. | imperial system |
|
|
|
6.
|
You and your family decide to travel to the United States. After crossing the
border, you notice speed limit signs saying the maximum speed is 60 miles/hour. What is this speed in
km/hour?
a. | 60.0 km/h | c. | 102.0 km/h | b. | 37.3 km/h | d. | 96.6 km/h |
|
|
|
7.
|
Given that  is similar to  and the dimensions of
 are 3 times those of  , what is the length of DE? a. | three times the length of AB | c. | three times length as
AC | b. | one-third the length of AB | d. | three times the length of BC |
|
|
|
8.
|
 is a scalene triangle. A similar triangle,  , is developed using a scale factor of 3. What is the measure of  DEF? a. | equal to  ABC ABC | c. | equal to six times  ABC ABC | b. | equal to one-sixth  ABC ABC | d. | equal to  BCA BCA |
|
|
|
9.
|
Classify Ð B and Ð
F in the triangles shown below. 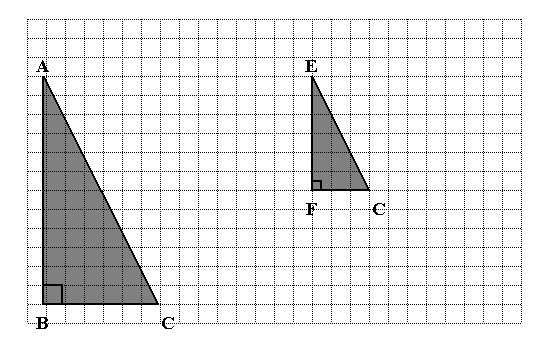 a. | right angles | c. | straight angles | b. | complimentary angles | d. | obtuse angles |
|
|
|
10.
|
A calculator is 12 cm long. The length of the calculator on a poster
advertisement is 27 cm. What is the scale used to create the poster?
|
|
|
11.
|
A voluntary response sample is created by
a. | dividing the population into groups and then choosing the same percent of respondents
from each group | c. | inviting the whole population to participate if they wish | b. | choosing respondents
from the population who are easy to access | d. | choosing respondents from the population at random |
|
|
|
12.
|
A sample of high school students is created by first dividing the whole student
body into age groups and then choosing the same fraction of members from each group. What type of
sampling method is used here?
a. | stratified | c. | convenience | b. | random | d. | systematic |
|
|
|
13.
|
A coach is checking the statistics on a player and wants to know whether the
player is making progress over the season. Is the graph shown below the best graph to use?  a. | No, because you cannot easily compare the data between two games. | c. | Yes, because you
can see a positive trend in the data over time. | b. | Yes, because the data can be easily
counted. | d. | No, because you
cannot see the full season. |
|
|
|
|
|
|
14.
|
Which graph would be best for showing the number of each type of movie that was
chosen?
a. | circle graph | c. | bar graph | b. | line graph | d. | double bar
graph |
|
|
|
15.
|
The best graph for showing the fraction of horror movies people chose would be
a
a. | line graph, to show changes over time | c. | pictograph that shows different
movie posters for each type | b. | circle graph, to show the percent of horror
movies out of all the choices | d. | double bar graph, to compare two sets of data across
categories |
|
Short Answer
|
|
|
16.
|
The scale diagram of a basketball court uses a scale of 1:280. The length of the
court measures 10 cm in the diagram. What is the actual length of the court, in metres?
|
|
|
17.
|
John uses a map to determine the distance between his hometown and the closest
campground. On the map, this distance is 3 cm. The actual distance is 9 km. What is the scale used on
the map?
|
|
|
18.
|
Katie made a drawing of her mountain bike. In the drawing, the diameter of the
front wheel is 10 cm. The actual size of the front wheel is 76 cm. What scale factor did Katie used
in her drawing?
|
|
|
19.
|
Write two different survey questions that may have resulted in the following
conclusion:
Yellow is the most popular shirt colour.
|
|
|
20.
|
A group of BC Lions fans are asked who they think will win the next Grey Cup.
a) Is this an appropriate sample? Explain.
b) What could be done to improve the
sample?
|
Problem
|
|
|
21.
|
Create a new image from the one below. Apply a scale factor of 0.625 and a
180° clockwise rotation. 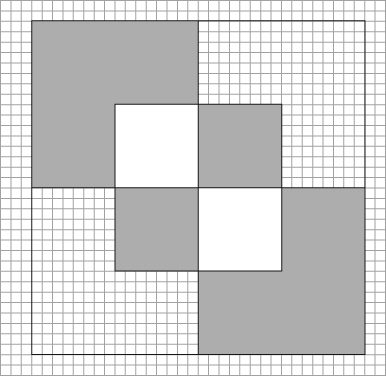
|
|
|
22.
|
A scale diagram of a bicycle wheel is shown below. The diameter, d, of
the wheel in the drawing is 6.3 cm. The thickness of the wheel, t, in the drawing is 0.2 cm.
If the actual thickness of the wheel is 2.3 cm, calculate the diameter of the wheel. Round all
answers to the nearest hundredth. 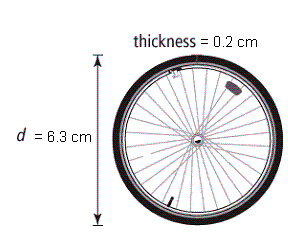
|
|
|
23.
|
A teacher gave his class a quiz worth 15 points. After marking the first five
quizzes (shaded part of the table), he is concerned that the class did not understand the lesson. The
scores for all 30 students in the class are: 6 | 6 | 9 | 8 | 11 | 12 | 13 | 15 | 9 | 10 | 11 | 12 | 8 | 15 | 9 | 10 | 14 | 12 | 15 | 11 | 7 | 9 | 4 | 6 | 9 | 12 | 12 | 13 | 10 | 12 | | | | | | | | | | |
a) Based on the teacher’s sample,
predict the “average” mark for the entire class. b) Why does the
teacher’s sample lead him to a false prediction?
|
|
|
24.
|
Suppose you were asked to find out the favourite restaurant in your town and you
decided to survey public opinion.
a) Who would make up the population?
b) How
would you select a sample so that is was not biased?
c) Describe a sample that would be
biased
d) Suggest a way of finding out the favourite restaurant without asking
people’s opinions.
|