Multiple Choice
Identify the
choice that best completes the statement or answers the question.
|
|
|
1.
|
Determine the scale factor for this reduction. 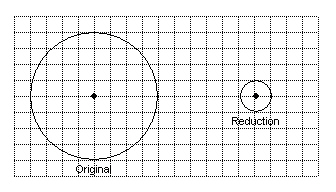
|
|
|
2.
|
Determine the length of AE in this pair of similar triangles.  Diagram not drawn to
scale Diagram not drawn to
scalea. | 2.3 cm | c. | 7.5 cm | b. | 3.3 cm | d. | 4.5 cm |
|
|
|
3.
|
Determine the length of BD in this pair of similar triangles.  Diagram not drawn to
scale Diagram not drawn to
scalea. | 3 cm | c. | 3 cm | b. | 6.75 cm | d. | 4 cm |
|
|
|
4.
|
You and your family decide to travel to the United States. After crossing the
border, you notice speed limit signs saying the maximum speed is 60 miles/hour. What is this speed in
km/hour?
a. | 60.0 km/h | c. | 102.0 km/h | b. | 37.3 km/h | d. | 96.6 km/h |
|
|
|
5.
|
An artist developed a scale diagram of the following layout for a stage. On his
scale diagram, 1 cm represents 0.5 m of actual distance. How far is it from H to J on the
stage? 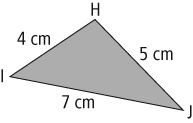 a. | 2 m | c. | 1.5 m | b. | 2.5 m | d. | 3.5 m |
|
|
|
6.
|
Triangles A and B are similar right triangles, related by a scale of 1:3. The
hypotenuse of Triangle B is approximately 72.5 cm. What is the approximate hypotenuse of Triangle
A? 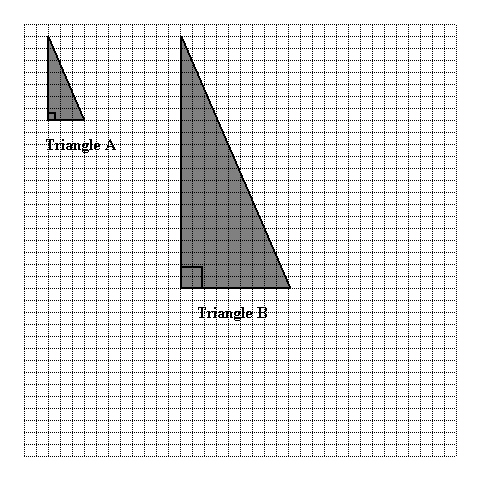 a. | 24.2 cm | c. | 108.8 cm | b. | 217.5 cm | d. | 31.1 cm |
|
|
|
7.
|
A scale diagram of a field uses a scale of 2 mm : 1 m. Determine the actual
distance from A to C. 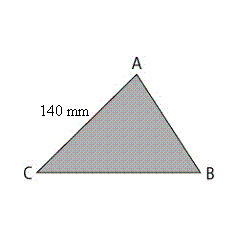
|
|
|
8.
|
What scale must be applied to make equilateral triangle JKL from equilateral
triangle RST? 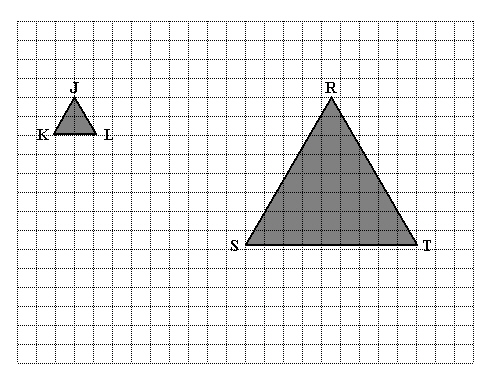
|
|
|
9.
|
What is the measure of angles K and S in the similar triangles shown? 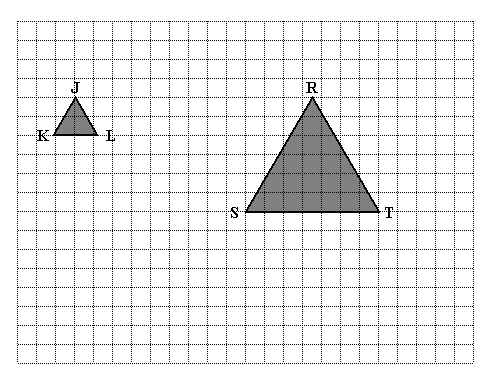
|
|
|
10.
|
Determine the scale used to draw the image on the right from the original image
on the left. 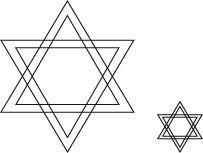
|
|
|
Choose the best answer.
|
|
|
11.
|
Sampling bias may result when
a. | the sample accurately represents the population | c. | participants are chosen at
random | b. | culturally sensitive questions are asked in the survey | d. | a large percent of people in the sample refuse
to answer the survey |
|
|
|
12.
|
During a team meeting, a hockey coach asks each person, “Who is our
weakest player?” This is an example of
a. | bias | c. | lack of privacy | b. | cultural insensitivity | d. | inappropriate
ethics |
|
|
|
13.
|
A voluntary response sample is created by
a. | dividing the population into groups and then choosing the same percent of respondents
from each group | c. | inviting the whole population to participate if they wish | b. | choosing respondents
from the population who are easy to access | d. | choosing respondents from the population at random |
|
|
|
Use the information provided to answer the following
question(s).Ms. Jenkins gave her class a quiz worth 15 points. After marking the first 4
quizzes, she predicted that the class would not do well on the test. The quiz scores are shown
below. 6 | 6 | 9 | 8 | 12 | 12 | 13 | 15 | 9 | 11 | 11 | 12 | 8 | 15 | 9 | 10 | 14 | 12 | 15 | 11 | 7 | 9 | 4 | 6 | 9 | 12 | 12 | 14 | 10 | 11 | | | | | |
|
|
|
14.
|
What is the mode score for the entire class?
|
|
|
|
|
|
15.
|
Which of the two graphs would you use if you wanted to know the total number of
plants in the garden?
a. | The circle graph, because it is easy to add the percents. | c. | The circle graph,
because it tells you there are 100 plants. | b. | The pictograph, because you can see how many
carrot plants are in each picture. | d. | The pictograph, because the symbols are easy to
count. |
|
Short Answer
|
|
|
16.
|
Joshua uses a map to determine the distance between his hometown and the closest
campground. On the map, this distance is 1.6 cm. The actual distance is 11.2 km. What is the scale
used on the map?
|
|
|
17.
|
Describe how you would create the image on the left by starting with the image
on the right. 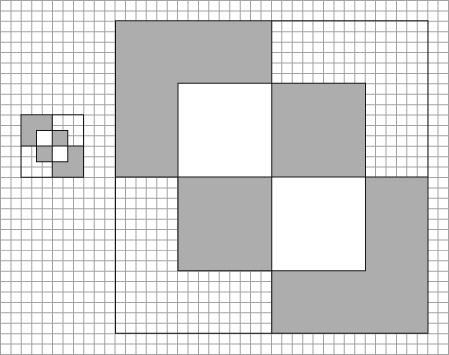
|
|
|
18.
|
Katie made a drawing of her mountain bike. In the drawing, the diameter of the
front wheel is 10 cm. The actual size of the front wheel is 76 cm. What scale factor did Katie used
in her drawing?
|
|
|
19.
|
Write two different survey questions that may have resulted in the following
conclusion:
Most juice lovers prefer apple and orange juice.
|
|
|
20.
|
A study has found that 23% of the fish in a lake are trout. A large fish trap
captures 126 fish. Predict how many of these fish are likely to be trout?
|
Problem
|
|
|
21.
|
Create a new image from the one below. Apply a scale factor of 0.625 and a
180° clockwise rotation. 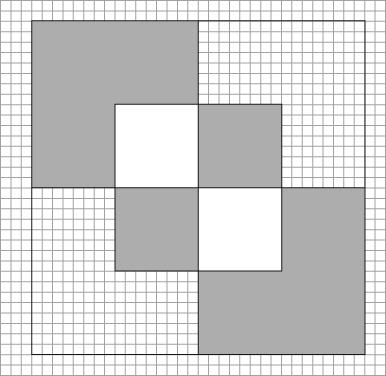
|
|
|
22.
|
A scale diagram of a bicycle wheel is shown below. The diameter, d, of
the wheel in the drawing is 6.3 cm. The thickness of the wheel, t, in the drawing is 0.2 cm.
If the actual thickness of the wheel is 2.3 cm, calculate the diameter of the wheel. Round all
answers to the nearest hundredth. 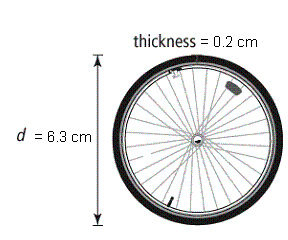
|
|
|
23.
|
A diagram of a house on a street is shown below. Determine the distance between
Point D and Point C. 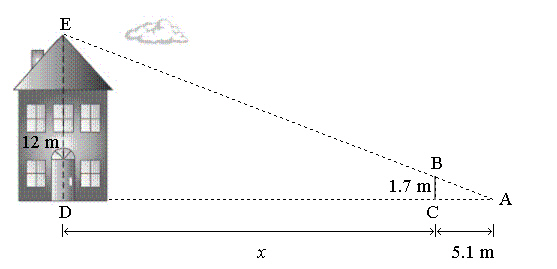
Diagram not drawn to scale
|
|
|
24.
|
For each context, would you recommend surveying the population or a sample?
Justify your choice. a) You want to determine the air quality
in hospitals in Victoria, BC.
b) You want to know post-secondary plans of grade 9
students.
c) You want to test the quality of parachutes.
d) You want to test the
quality of bike tires.
|
|
|
25.
|
The graph shows the progress of friends who are
playing a video game.
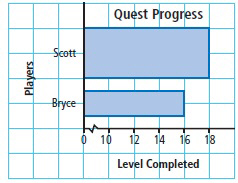
a) Explain how this graph could be
misleading.
b) What conclusion does the graph suggest about Scott’s progress compared
with Bryce’s progress?
c) Describe how to redraw the graph to represent the data more
accurately.
|