Multiple Choice
Identify the
choice that best completes the statement or answers the question.
|
|
|
1.
|
A non-standard measuring unit that you choose to use is called a(n)
__________.
a. | metre | c. | instrument | b. | referent | d. | caliper |
|
|
|
2.
|
What is the approximate perimeter of the figure shown below?  a. | 20 mm | c. | 20 m | b. | 20 km | d. | 20 cm |
|
|
|
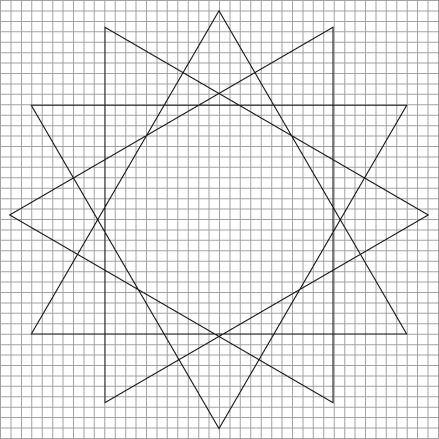
Use this star figure to answer the following question(s).
|
|
|
3.
|
Which star figure below best represents the original star with a scale factor of
80%? Each square in all grids represents one square unit.
|
|
|
4.
|
A scale factor less than 1 indicates __________.
a. | that the image is a different shape than the actual object | c. | that the image is
the same size as the actual object | b. | that the image is an enlargement of the actual
object | d. | that the image is a
reduction of the actual object |
|
|
|
5.
|
What scale factor is used to enlarge the letter on the left? 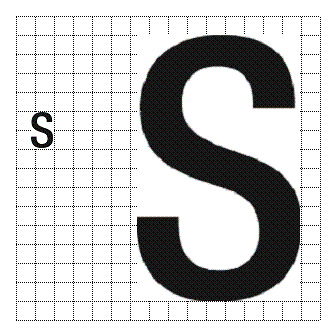
|
|
|
6.
|
Determine the scale factor for this enlargement. 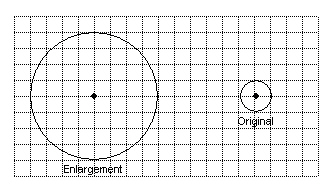
|
|
|
7.
|
You and your family decide to travel to the United States. After crossing the
border, you notice speed limit signs saying the maximum speed is 60 miles/hour. What is this speed in
km/hour?
a. | 60.0 km/h | c. | 102.0 km/h | b. | 37.3 km/h | d. | 96.6 km/h |
|
|
|
8.
|
Triangles A and B are similar right triangles, related by a scale of 1:3. The
hypotenuse of Triangle B is approximately 72.5 cm. What is the approximate hypotenuse of Triangle
A? 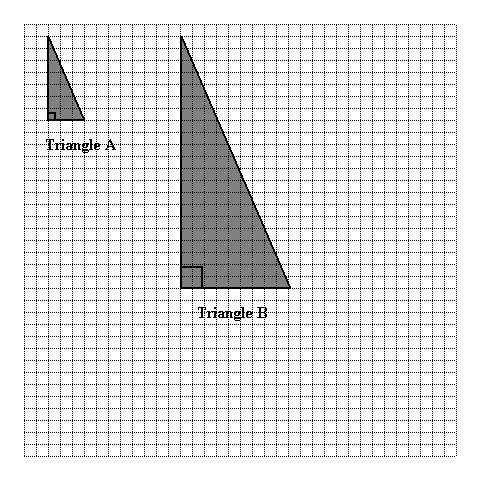 a. | 24.2 cm | c. | 108.8 cm | b. | 217.5 cm | d. | 31.1 cm |
|
|
|
9.
|
A farmer sketched the following layout of a field. He wants to develop a scale
drawing of the field in which 1 cm on the diagram represents 5 m of actual distance. The pipeline
runs across the diagonal of the field. Approximately how long will the line that represents the
pipeline be in the scale diagram? 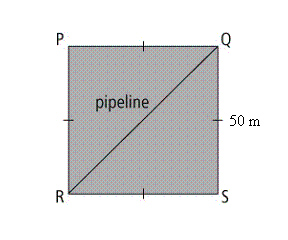 a. | 500.0 cm | c. | 14.1 cm | b. | 10.0 cm | d. | 5.0 cm |
|
|
|
10.
|
What scale is used to create the image on the right from the original image on
the left? 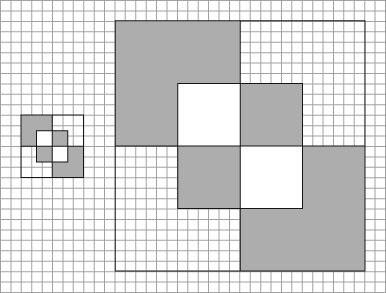
|
|
|
Choose the best answer.
|
|
|
11.
|
Sampling bias may result when
a. | the sample accurately represents the population | c. | participants are chosen at
random | b. | culturally sensitive questions are asked in the survey | d. | a large percent of people in the sample refuse
to answer the survey |
|
|
|
12.
|
A school principal surveys only the boys in one class to determine if she should
make recess longer. This is an example of
a. | inappropriate use of language | c. | cultural
insensitivity | b. | bias | d. | poor
timing |
|
|
|
13.
|
A survey asks respondents, “Which of these four religions is the
best?” This is an example of
a. | poor timing | c. | bias | b. | inappropriate use of
language | d. | cultural
insensitivity |
|
|
|
14.
|
Martin is conducting a survey to determine if the school cafeteria should stop
selling soft drinks. From what population should he take his sample?
a. | people who work at a soft-drink factory | c. | adults who have no
kids | b. | people who eat lunch in the cafeteria | d. | people who are allergic to soft
drinks |
|
|
|
|
|
|
15.
|
How could you distort the graph to decrease the improvement between Game 4 and
Game 6?
a. | Change the thickness of the lines. | c. | Change the symbols on the line for
each player. | b. | Change the y-axis so that the higher numbers have smaller gaps between
them. | d. | Change the
x-axis to allow a break before Game 4. |
|
Short Answer
|
|
|
16.
|
The screen on a digital camera is 3.5 cm wide. After a picture is taken, the
image is 1.8% the size of the actual object. If the image of an object is as wide as the screen, what
is the actual width of the object?
|
|
|
17.
|
Andy designed a tote bag. In a drawing of the tote bag, the length of the bag is
12 cm. The actual length of the bag is 20 cm. What scale factor did Andy use in his drawing?
|
|
|
18.
|
The scale diagram of a basketball court uses a scale of 1:280. The length of the
court measures 10 cm in the diagram. What is the actual length of the court, in metres?
|
|
|
19.
|
Write a survey question for the following situation. Identify who you would ask
to participate in the survey.
You want to find out if price or brand is
more important when buying a cell phone.
|
|
|
20.
|
A study has found that 23% of the fish in a lake are trout. A large fish trap
captures 126 fish. Predict how many of these fish are likely to be trout?
|
Problem
|
|
|
21.
|
A map of a nature reserve shows the location of three look-out points. On the
map, the distance between Point A and Point B is 9 cm and the distance between Point B and Point C is
12 cm. Each centimetre on the map represents 17 km of actual distance. Calculate the actual distance
between Point A and Point C. 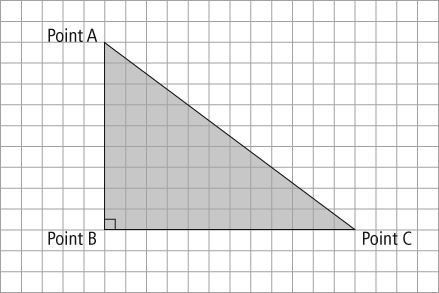
|
|
|
22.
|
Create a new image from the one below. Apply a scale factor of 0.625 and a
180° clockwise rotation. 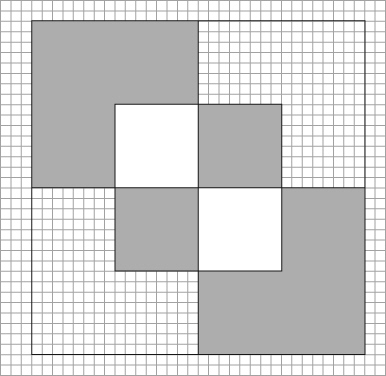
|
|
|
23.
|
A scale diagram of a bicycle wheel is shown below. The diameter, d, of
the wheel in the drawing is 6.3 cm. The thickness of the wheel, t, in the drawing is 0.2 cm.
If the actual thickness of the wheel is 2.3 cm, calculate the diameter of the wheel. Round all
answers to the nearest hundredth. 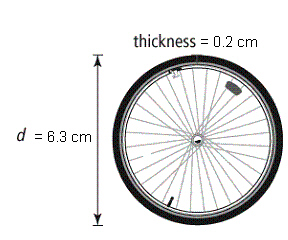
|
|
|
24.
|
For each situation, identify and describe any influencing factors that may
affect the survey.
a) The first 50 people entering the public pool are asked if they are
willing to pay increased rates to help fund the pool’s operation.
b) Fifteen shoppers
randomly selected in a supermarket are asked, “Do you not dislike rotisserie
chicken?”
c) Ten hockey players are asked if they would support cancelling the hockey
team and replacing it with a curling team.
|
|
|
25.
|
Critique the graph below. Is it misleading or does it misrepresent the data in
any way? Explain your thinking. 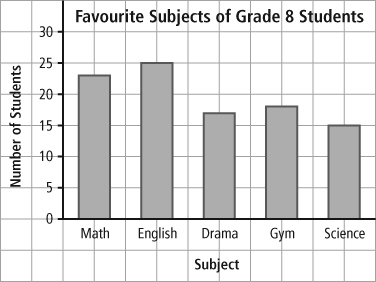
|