Multiple Choice
Identify the
choice that best completes the statement or answers the question.
|
|
|
Choose the best answer.
|
|
|
1.
|
Determine the scale factor for this scale diagram. 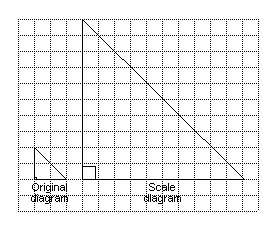 a. | 5 | c. | 25 | b. |  | d. | 10 |
|
|
|
2.
|
In a photo, the length of a model car is 4.2 cm. The photo is to be enlarged by
a scale factor of 5.5. Determine the length of the car in the photo enlargement.
a. | 19.4 cm | c. | 46.2 cm | b. | 9.7 cm | d. | 23.1 cm |
|
|
|
3.
|
A pencil has a diameter of 9 mm. A scale diagram of the pencil has a diameter of
2.7 cm. Determine the scale factor of the diagram.
a. |  | c. | 30 | b. | 3 | d. | 0.3 |
|
|
|
4.
|
A square frame is projected onto a screen using an overhead projector. The
original square frame has a side length of 8.5 cm. The square frame is enlarged by a scale factor of
6.4. Determine the side length of the square frame on the screen.
a. | 14.9 cm | c. | 54.4 cm | b. | 217.6 cm | d. | 108.8 cm |
|
|
|
5.
|
Identify which rectangles have similar dimensions:
a) 10 cm by 15 cm
b) 19
cm by 28 cm
c) 14 cm by 21 cm
d) 16 cm by 24 cm
a. | a, c, and d | c. | b and d | b. | b, c, and d | d. | a and b |
|
|
|
6.
|
Matt wants to build a trundle wheel, or measuring wheel. He wants the wheel to
go around once for every 1.7 metres the trundle wheel is pushed. What will be the approximate
diameter of his trundle wheel?
a. | 3.70 m | c. | 1.08 m | b. | 0.27 m | d. | 0.54 m |
|
|
|
7.
|
Given that  is similar to  and the dimensions of
 are 3 times those of  , what is the length of DE? a. | three times the length of AB | c. | three times length as
AC | b. | one-third the length of AB | d. | three times the length of BC |
|
|
|
8.
|
A scale diagram of a field uses a scale of 2 mm : 1 m. Determine the actual
distance from A to C. 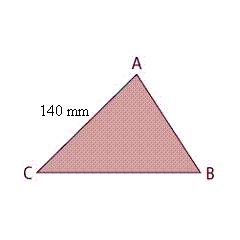
|
|
|
9.
|
Classify ÐA and ÐE in the triangles shown below. 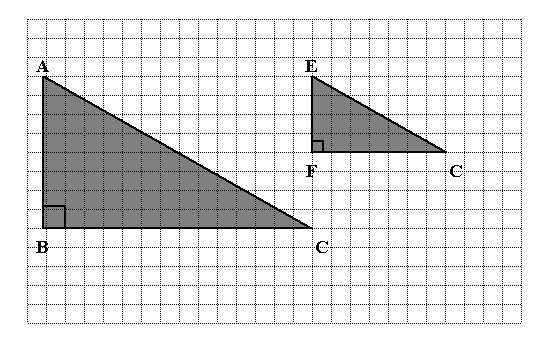 a. | straight angles | c. | right angles | b. | obtuse angles | d. | corresponding
angles |
|
|
|
10.
|
What scale is used to create the image on the right from the original image on
the left? 
|
|
|
11.
|
A school principal surveys only the boys in one class to determine if she should
make recess longer. This is an example of
a. | inappropriate use of language | c. | cultural
insensitivity | b. | bias | d. | poor
timing |
|
|
|
Answer the following question(s) using the information from the scenario
below.
The owner of a pet store in a shopping mall wants to conduct a survey. She decides
to survey the first 100 people who pass her store as soon as the mall opens. She chooses this time
because her store is not busy first thing in the morning.
|
|
|
12.
|
If she walked around the mall and surveyed every tenth person, this would
provide a
a. | systematic sample | c. | convenience sample | b. | voluntary response sample | d. | random sample |
|
|
|
13.
|
Students are surveyed to find out their favourite sport. What method of
selection will produce an unbiased sample?
a. | ask only the people who play sports | c. | ask every 5th person on the school
list | b. | ask only the boys | d. | ask the first 20 people who leave the basketball game |
|
|
|
Use the information provided to answer the following
question(s).Ms. Jenkins gave her class a quiz worth 15 points. After marking the first 4
quizzes, she predicted that the class would not do well on the test. The quiz scores are shown
below. 6 | 6 | 9 | 8 | 12 | 12 | 13 | 15 | 9 | 11 | 11 | 12 | 8 | 15 | 9 | 10 | 14 | 12 | 15 | 11 | 7 | 9 | 4 | 6 | 9 | 12 | 12 | 14 | 10 | 11 | | | | | |
|
|
|
14.
|
If the sample is biased, what should Ms. Jenkins have done differently?
a. | She should have calculated the mean, median, and mode for the sample. | c. | She should have
used the scores from the first five students to finish the quiz. | b. | The sample is not
biased. | d. | She should have
randomly selected a larger sample of student quizzes to mark. |
|
|
|
|
|
|
15.
|
How is the pictograph misleading?
a. | The images of the beans are not of real beans. | c. | The images of the broccoli are
larger than the other images. | b. | The images of the beans are
unclear. | d. | The images of the
snow peas contain bits of other produce. |
|
Short Answer
|
|
|
16.
|
Andy designed a tote bag. In a drawing of the tote bag, the length of the bag is
12 cm. The actual length of the bag is 20 cm. What scale factor did Andy use in his drawing?
|
|
|
17.
|
Draw a triangle similar to  KLM using a scale factor of 0.35. Label
the length of each side. 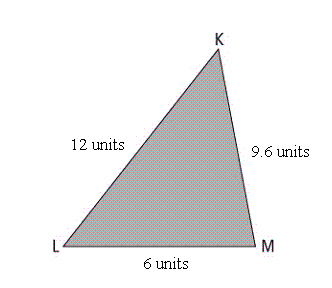
|
|
|
18.
|
Use the grid provided to draw an enlargement of the letter using a scale factor
of 11. 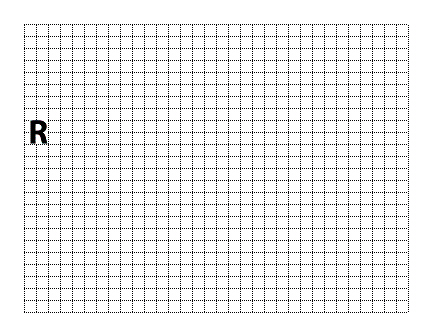
|
|
|
19.
|
Rewrite the following survey question, asked of people entering a movie theatre,
so that it does not have any influencing factors:
Who is your favourite male movie star?
a)
Ryan Gosling
b) Chris Pratt
c) Benedict Cumberbatch
d) Other
|
|
|
20.
|
Explain how this graph could be misleading.

|
Problem
|
|
|
21.
|
Don walks from his home to his school. After school, he walks to the convenience
store and then returns home. His actual route is shown below. Draw a scale diagram of Don’s
route, where 1 cm on the map represents 180 m of actual distance. Label each location, the scale
distances between these locations, and the angles. 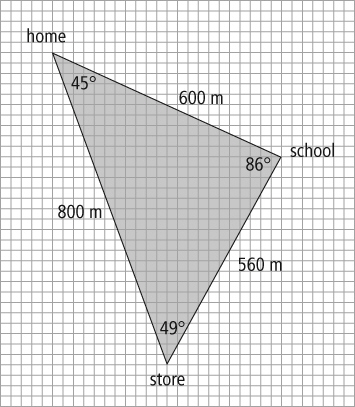
|
|
|
22.
|
A map case is a cylindrical tube with two end caps. The case is 250 cm long and
8 cm in diameter. What is the total surface area of the map case including end caps, in square
metres?
|
|
|
23.
|
You have an aquarium that measures 100 cm × 25 cm × 50 cm. While you
are filling it with water, you wonder just how many litres it will take. If 1 cm3 = 1 mL,
how many litres are needed to fill the aquarium?
|
|
|
24.
|
Jason, a member of the Graduation Committee, plans to ask each student who
enters the cafeteria the following questions.
What is your favourite paint colour for the
cafeteria walls? ________
Should the cafeteria be used for graduation? YES
NO
a) Identify the population.
b) Identify the sample.
c) Will the
results of his survey accurately represent the population? Explain.
d) Is Jason correct in
using the same sample for both questions? Explain your thinking.
|
|
|
25.
|
Samantha recorded the temperature on a hot day. She displayed the data in a line
graph. a) Explain how this graph could be misleading. b) What conclusion does the
graph suggest about the changes in temperature? c) How should the graph be redrawn to make
the data clearer? 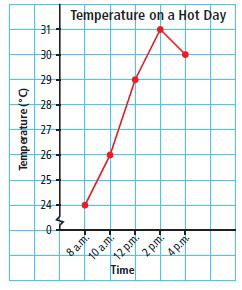
|